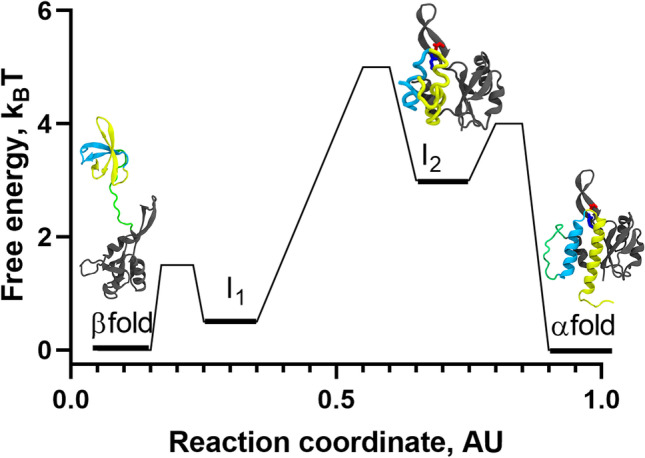
Fig. 4.

Refolding landscape of RfaH obtained from MD simulations at interdomain contact strength of 50% using a coarse-grained dual-basin SBM. The protein structures in cartoon representation correspond to the native and intermediate states observed during the refolding simulations. The NTD (100 residues) is colored gray, whereas the first and second helix of the CTD (51 residues) are colored in cyan and yellow, respectively, and the 11-residue linker connecting both domains is colored green. Based on the contact map for I1, which contains many of the native contacts of the β-folded CTD, it is likely that it structurally belongs to the β-fold energy minimum according to β/I1 ⇄ I2 ⇄ α. The reaction coordinate was created to project the complex refolding landscape of RfaH in two dimensions
