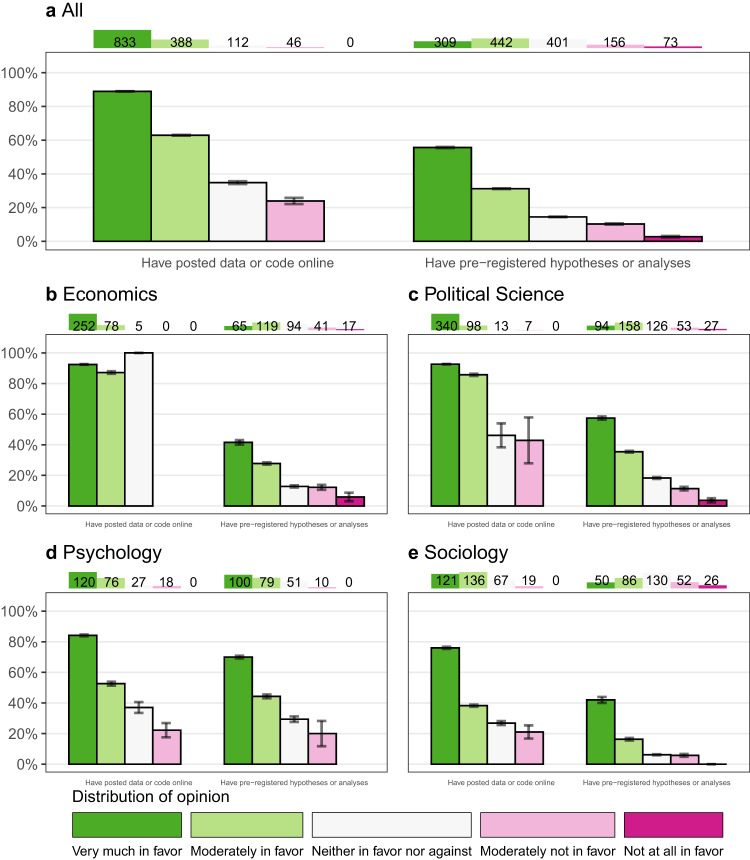
Fig. 3. Posting behavior by attitude published authors.
The chart shows the relationship between attitudes and behavior for the published authors in our sample. Each panel restricts to published authors in different disciplines. The chart shows attitudes and behavior for two open sciences practices: posting data or code online (left side of each panel) and pre-registering hypotheses or analyses (right side of each panel). Each bar represents published authors who stated that they were more or less supportive of the open science practice, with green indicating more support for the practice and red colors indicating less support for the practice. The height of the bar then displays the proportion of authors (i.e., the mean) with this attitude toward the open science practice who have done the practice previously. 95% Confidence Intervals are shown by the black whiskers on top of the bar. The number on top of the panel shows the total number of authors who have this attitude toward the practice. Panel a shows data from all published author responses, and Panels b–e show responses from published authors identified as economists, political scientists, psychologists, and sociologists, respectively.

