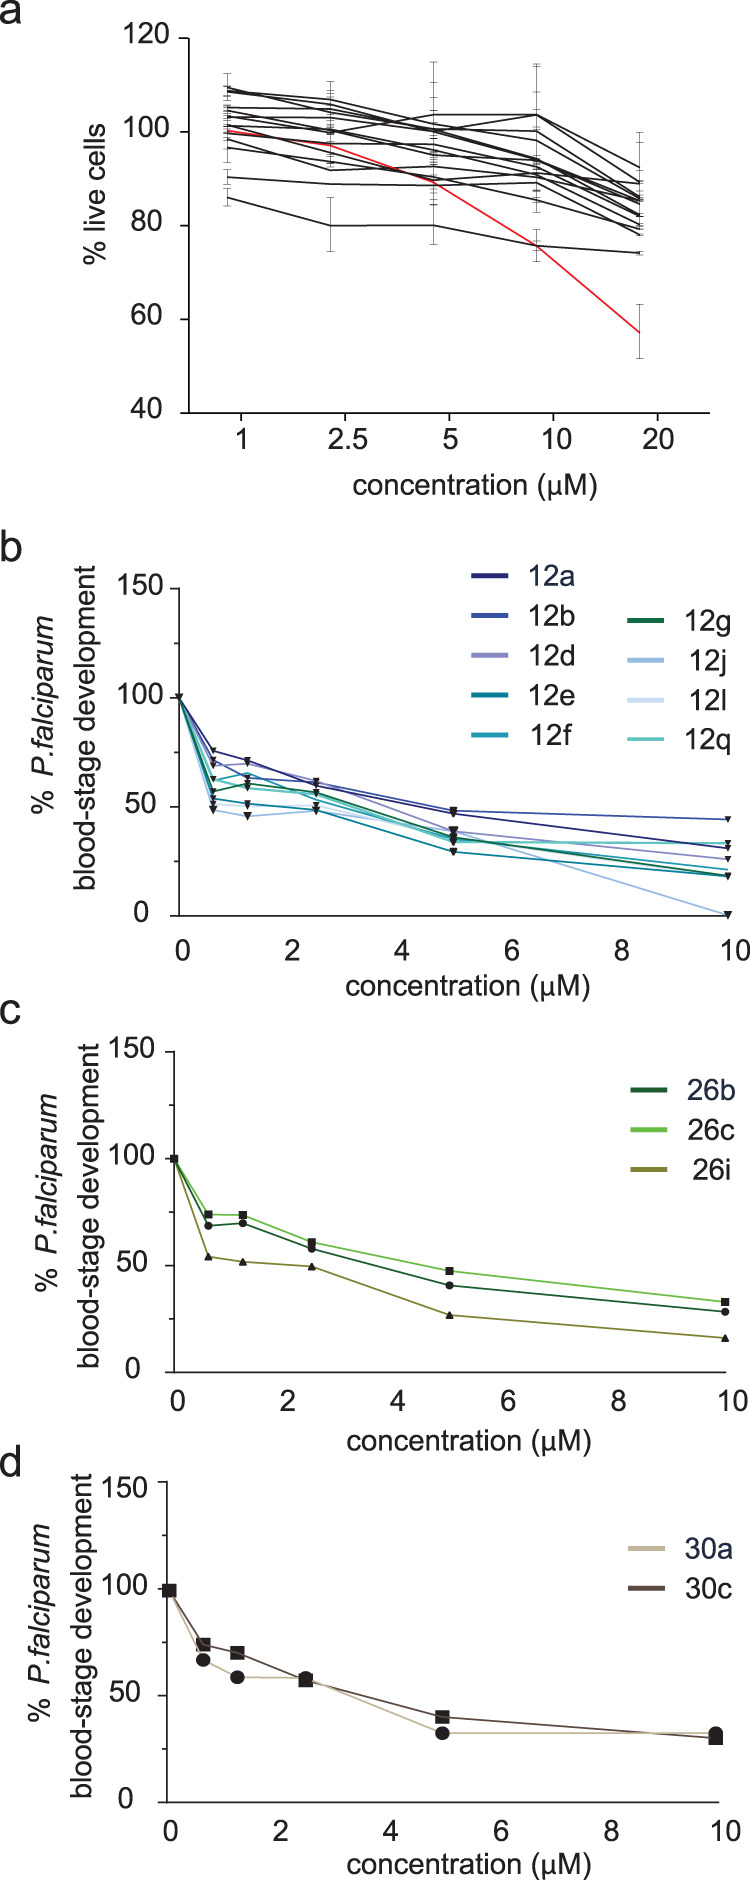
Fig. 4. NMT inhibitors show minimal toxicity in human hepatoma cells and reduce Plasmodium falciparum blood-stage development.

a Percentage of live HepG2 cells after 48-hour treatment with each NMT inhibitor (shown in black) compared with that of controls treated with diluent. Data are presented as mean values ± SD. The staurosporine-positive control is shown in red. b–d Percentage change in P. falciparum blood-stage development as measured by parasite DNA level fluorescence assay after 72-hour treatment with NMT inhibitors from each of the three prioritized compound families. Data are normalized to untreated controls set at 100%. Source data are provided as a Source Data file.
