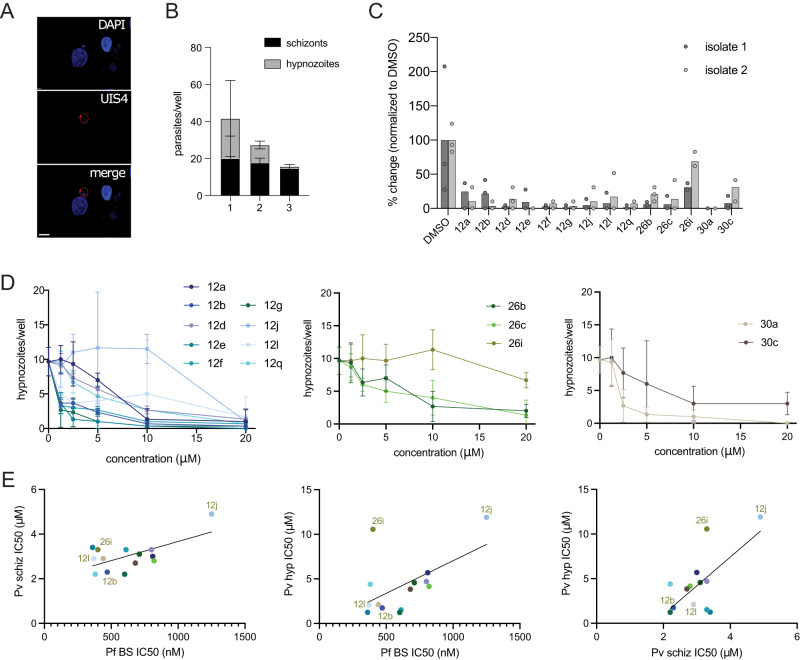
Fig. 6. NMT inhibitors reduce P. vivax hypnozoite forms in vitro.
A Representative image of hypnozoite form 8 dpi. Scale bar: 10 µm. B Schizont and hypnozoite infection levels for each isolate. Data are presented as mean values ± SD. C Effect of NMT inhibitor compounds on hypnozoite infection levels 8 dpi for 2 independent parasite isolates. All compounds were administered at 20 µM with DMSO as a control. Data from each isolate are normalized to the average of their DMSO control and are shown as mean values overlaid with 3 (isolate 1) or 2 (isolate 2) technical replicates. D Dose–response curves for each compound, grouped by family, for isolate 2. Data are shown as mean values ± SD; n = 3. E Correlations between IC50 against P. falciparum blood-stage (Pf BS), P. vivax schizont (Pv schiz), and P. vivax hypnozoite (Pv hyp) infection plotted against each other for each NMTi. Source data are provided as a Source Data file.

