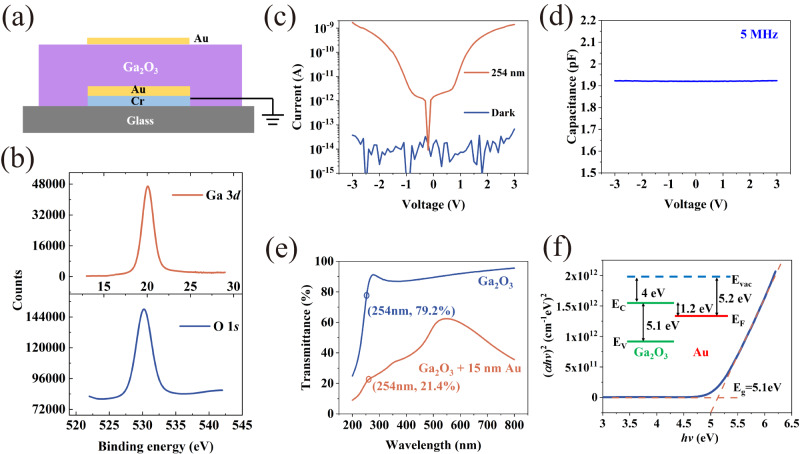
Fig. 2. Characterization of the vertical structure based on Ga2O3 film.
a Schematic diagram of the vertical structure. b XPS spectra of the Ga2O3 film. The upper and lower panels show the core level spectra of Ga 3d and O 1 s. c I–V curves in dark (blue curve) and under 254 nm illumination (orange curve). d C–V sweep curve at 5 MHz. e Optical transmittance spectra of the Ga2O3 (45 nm) film (blue curve) and the Ga2O3 (45 nm) + Au (15 nm) film (orange curve). f The plot of (αhν)2 versus hν for Ga2O3 film. The inset is the energy band structure of Ga2O3 and Au.

