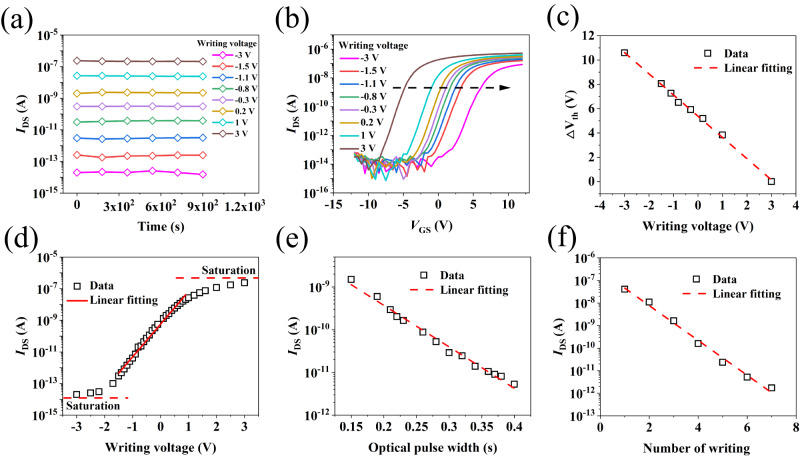
Fig. 4. Tests of the multilevel storage.
a Retention test of different states formed by different VGS pulses (keeping the optical pulse at 254 nm, 160 µW cm−2, 1 s). The corresponding relationship between color and writing voltage is shown in the legend. b Transfer curves of different states formed by different VGS pulses. The corresponding relationship between color and writing voltage is shown in the left legends. c Linear fitting of ∆Vth for different states formed by different VGS pulse. The Vth is defined as the value of VGS when IDS = (W/L) × 1 nA, W and L are width and length of the channel, respectively. d Linear fitting of IDS for different states formed by different VGS pulse. e Linear fitting of IDS for different states formed by different optical pulse width (optical pulse: 254 nm, 160 µW cm−2; VGS pulse: −4 V). f Linear fitting of IDS for different states formed by different number of writing (optical pulse: 254 nm, 60 µW cm−2, 50 ms; VGS pulse: −3 V).

