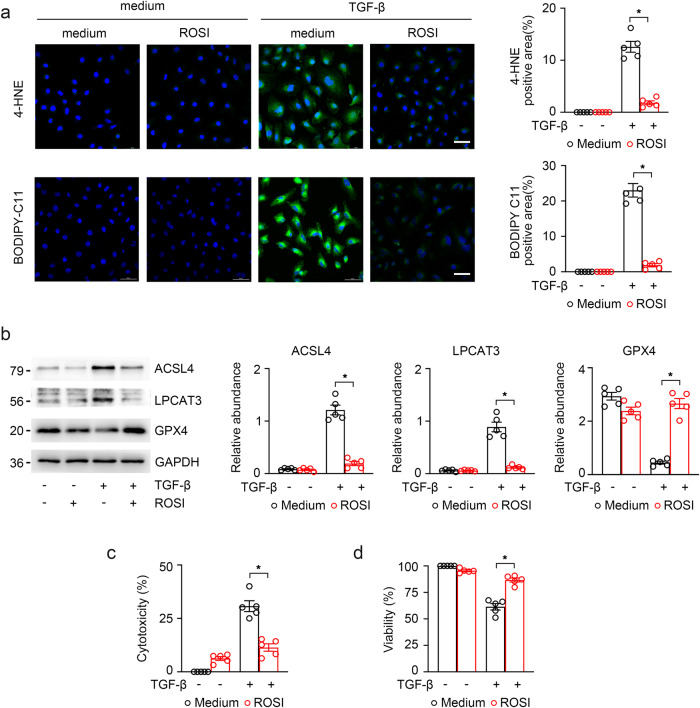
Fig. 3. The relationship between ACSL4 inhibition and TECs ferroptosis in vitro.
a Control and TGF-β-induced cells treated with 100 μM ROSI for 48 h were labeled with BODIPY 581/591 C11 and immunofluorescence stained with 4-HNE. Quantitative images to depict fluorescence intensity at the right panel. Scale bar = 50 μm. b Western-blot analysis of ACSL4, LPCAT3 and GPX4 in TGF-β-induced HK-2 cells. Representative images from three independent experiments are shown above. Schematic representation of quantitative data of indicated proteins (right panel). c, d Cell viability measured via MTT and cell cytotoxicity assayed via LDH revealed an obviously change in the death of cultured HK-2 cells in different groups. These data are calculated from more than three independent experiments. Data are presented as mean ± SEM. *P < 0.05, ns means no statistical significance.

