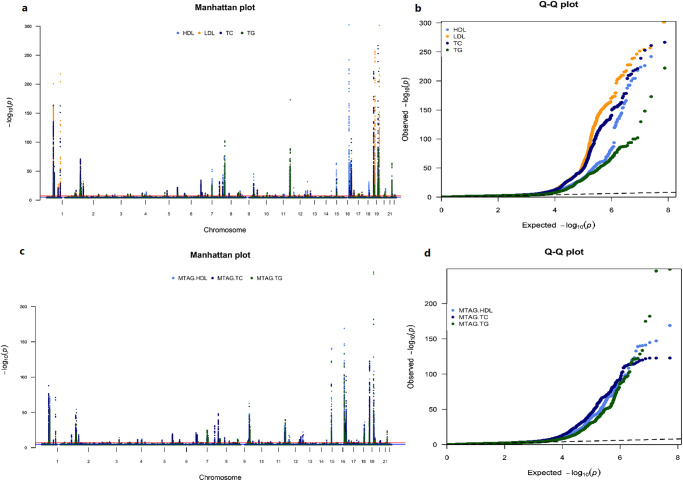
Fig. 1. Genome-wide association study (GWAS) for lipid traits in individuals of African ancestry.
a, b are Manhattan and QQ plot, respectively for GWAS meta-analysis (N = ~125,000). c, d are Manhattan and QQ plot, respectively for multi-trait analysis of GWAS (MTAG, N = ~125,000). X-axis are the genomic position, the Y-axis represents the log10 of association p-values and the point above the dotted line represented variants significant at p-value < 5 × 10⁻⁸. P-values are two-tailed calculated using GWAMA for meta-analysis and MTAG for multi-trait analysis of GWAS, not adjusted for multiple comparisons. Of the 87 (seven novel) loci for the meta-analysis of GWAS and 85 (13 novel) loci for MTAG analyses corresponding to 107 distinct loci (65 shared) were identified. In b, and d is a comparison of the expected distribution of association −log10 p-values under the null distribution. Leftward deviation of the curves from the dotted line of expected values indicated more associated loci than expected.

