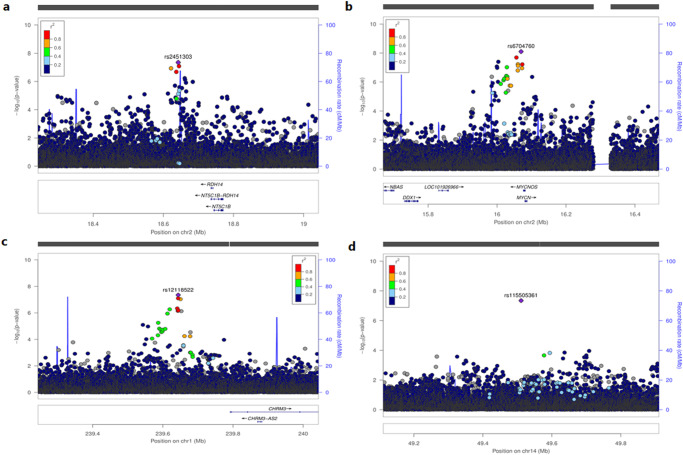
Fig. 2. Novel loci associated with lipid traits in individuals of African ancestry from the meta-analysis genome-wide association analysis (N = ~ 125,000).
a Locuszoom plot showing associations around the intergenic regions between NT51B and RDH14 region. b Locuszoom plot showing associations around the intergenic region between MYCN and MYCNOS. c Locuszoom plot showing associations around the CHRM3 region. d Locuszoom plot showing associations around the MGAT2 region.

