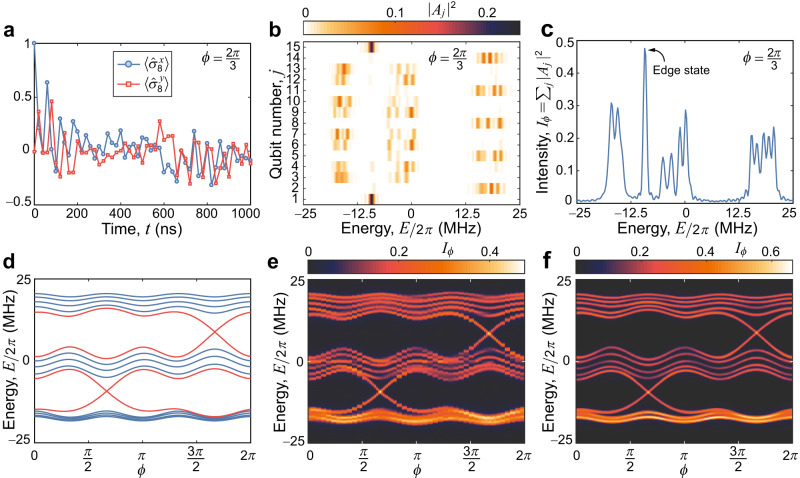
Fig. 2. Band structure spectroscopy of the 2D Chern insulator with a synthetic dimension.
a Typical data of and versus time t when choosing Q8 as the target qubit for , Δ/2π = 12 MHz and . b Squared FT magnitudes ∣Aj∣2 of the response functions for all fifteen qubits. Note that the edge states at the edge qubits: Q1 and Q15. c Summation of the squared FT magnitudes Iϕ ≡ ∑j∣Aj∣2. d Band structure of the 2D Chern insulator for and Δ = 12 MHz with 15 sites along the x-direction and periodic along the y direction. Red curves show the edge states. e, f Experimentally measured data for Iϕ (e) for different values of ϕ varied from 0 to 2π are compared with numerically calculated data of Iϕ (f) obtained by numerically simulating the dynamics of the 15-qubit system without decoherence.

