
Figure 1. Top: Clustering results and modes/groups for plasma Aβ42/40 ratio.
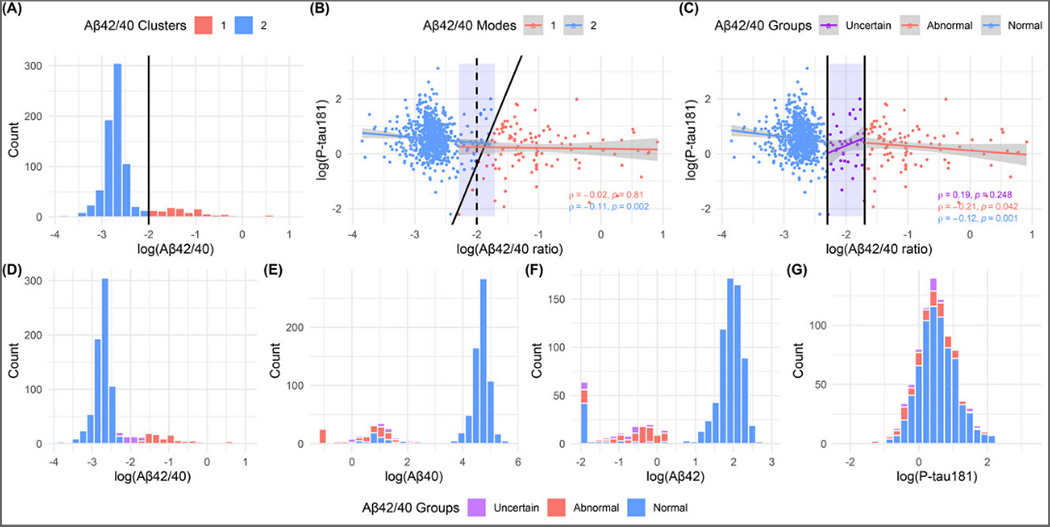
The figure A shows the distribution for Aβ42/40 ratio filled by its K-medoids clustering result; the cutoff point is −2. Figure B is the scatterplot for plasma Aβ42/40 ratio and p-tau181 colored by their K-medoids clustering result. The black dash line is the cutoff point for Aβ42/40 ratio mapped to 2-dimension. The scatterplot in figure C shows the association between Aβ42/40 ratio and p-tau181 colored by three groups. The groups (Normal: < −2.3, Uncertain: [−2.3, −1.7], and Abnormal: > −1.7) are defined based on the plasma Aβ42/40 ratio values. The black solid lines are the boundaries of modes or groups. The blue rectangles are the uncertain group. Bottom: Distributions of biomarkers. The histograms of plasma (D) Aβ42/40 ratio, (E) Aβ40, (F) Aβ42, and (G) p-tau181 filled by Aβ42/40 ratio groups. Aβ = amyloid β, p-tau181 = tau phosphorylated at threonine 181, GFAP = glial fibrillary acidic protein, NfL = neurofilament light.