
Figure 3. Associations between memory composite score and plasma biomarkers by Aβ42/40 ratio modes and groups.
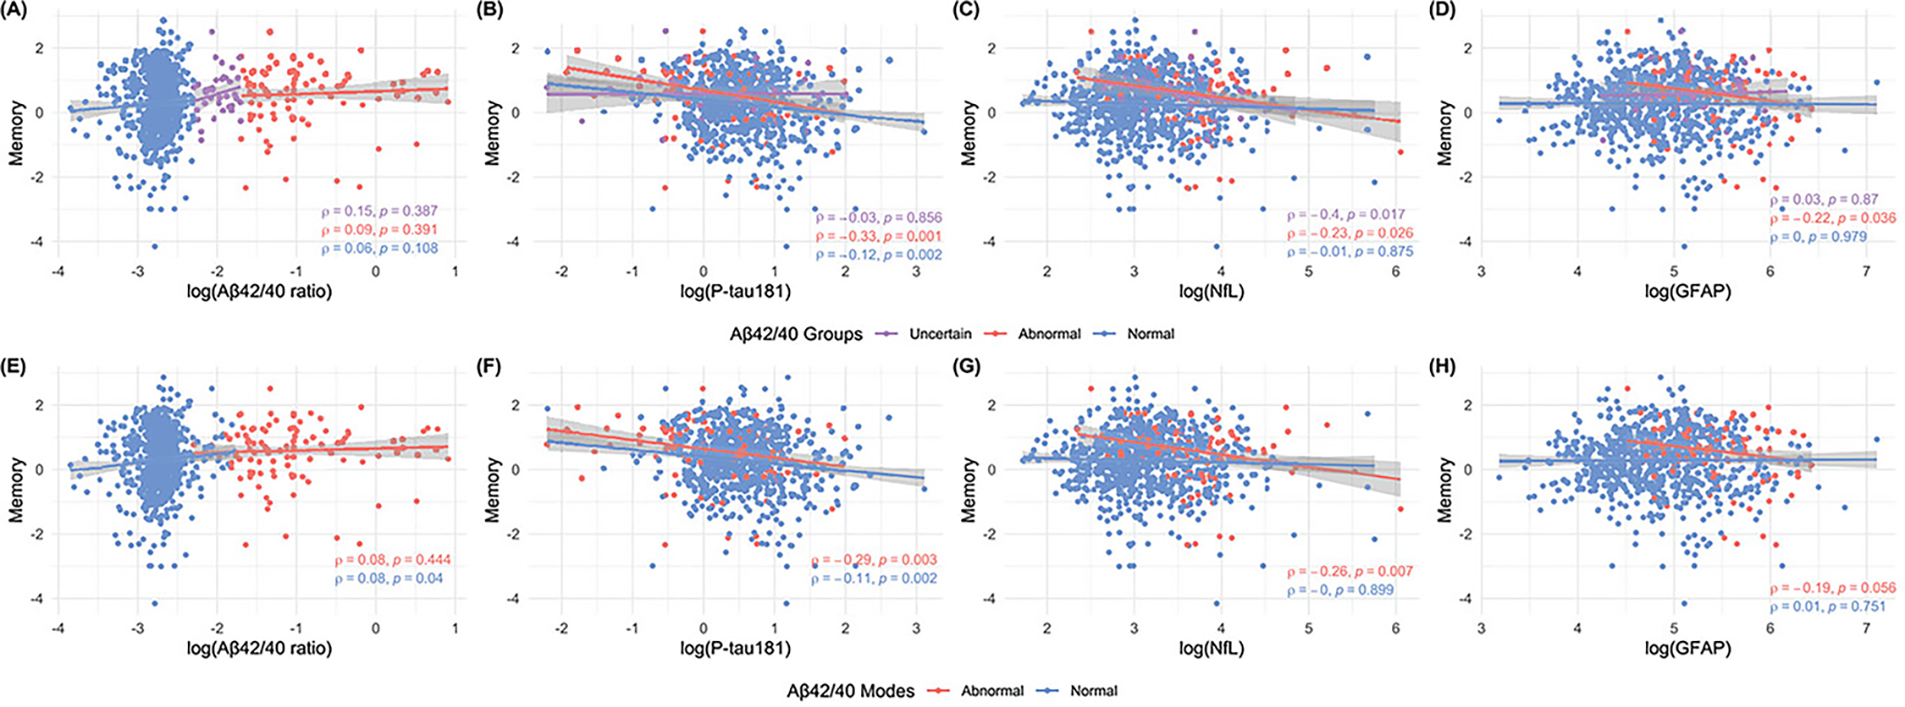
The upper panel shows the association between memory composite score with plasma (A) Aβ42/40 ratio, (B) p-tau181, (C) NfL, and (D) GFAP by Aβ42/40 ratio groups (Normal, Uncertain, and Abnormal; defined using pre-defined cutoffs). The lower panel shows the association between memory composite score with plasma (E) Aβ42/40 ratio, (F) p-tau181, (G) NfL, and (H) GFAP by Aβ42/40 ratio modes (Normal, and Abnormal; defined based on previous clustering results). All figures are annotated with Spearman’s rho rank correlations and corresponding unadjusted two-sided p-values. Points are colored by plasma Aβ42/40 groups or modes. The regression lines are fitted by robust linear regression and shaded areas represent the 95% confidence intervals. Aβ = amyloid β, p-tau181 = tau phosphorylated at threonine 181, GFAP = glial fibrillary acidic protein, NfL = neurofilament light. The side-by-side presentation of plasma Aβ42/40 ratio associations with composite meomory scores in the three- versus two-group clusters enabled evaluation of how the intermediate zone alters the relationships.