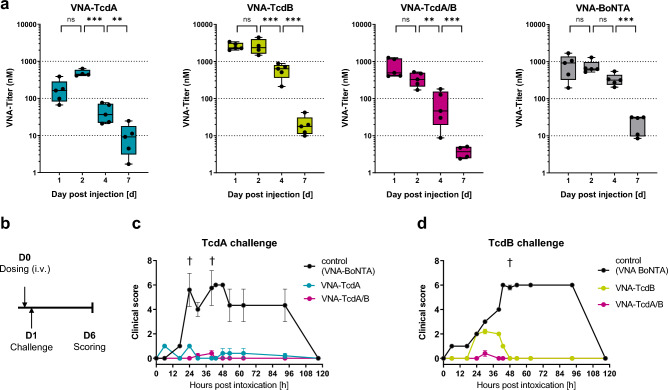
Figure 2.
In vivo characterization of mRNA-LNP-encoded VNAs. (a) Quantification of serum VNA levels by O-tag detection ELISA (Supplement Table 2) at various time points. Outbred CD-1 mice received a single intravenous injection of 10 µg mRNA-LNP encoding respective VNAs. Data are depicted as whisker plots showing min to max values. For each timepoint, an independent cohort of five mice was used. *p < 0.05, **p < 0.01, ***p < 0.001. (b) Illustration of dosing and challenge regimen. Outbred CD-1 mice received a single intravenous injection of 10 µg of mRNA-LNP encoding individual VNAs. After 24 h, animals were challenged with 25 ng of either TcdA or TcdB toxin. Following challenge, animals were scored for clinical symptoms for a period of 120 h (day 6 post injection). (c) Protective efficacy of mRNA-LNP encoded VNAs in mice exposed to TcdA challenge according to schedule illustrated in (b). Mice which received 10 µg of mRNA-LNP encoding either VNA-TcdA (blue), VNA-TcdA/B (pink) or VNA-BoNTA (grey, irrelevant VNA) were scored for symptoms of toxemia (Supplement Table 3) and euthanized when exceeding the humane endpoint. Error bars represent the standard error (SEM) of five mice per groups. †Individual animals which succumbed to toxin challenge (group indicated by color). (d) Protective efficacy of mRNA-LNP encoded VNAs in mice exposed to TcdB challenge according to schedule illustrated in (b). Mice which received 10 µg of mRNA-LNP encoding either VNA-TcdB (green), VNA-TcdA/B (pink) or VNA-BoNTA (grey, irrelevant VNA) were scored for symptoms of toxemia (Supplement Table 3) and euthanized when exceeding the humane endpoint. Error bars represent the SEM of five mice per groups. †Individual animals which succumbed to toxin challenge (group indicated by color).

