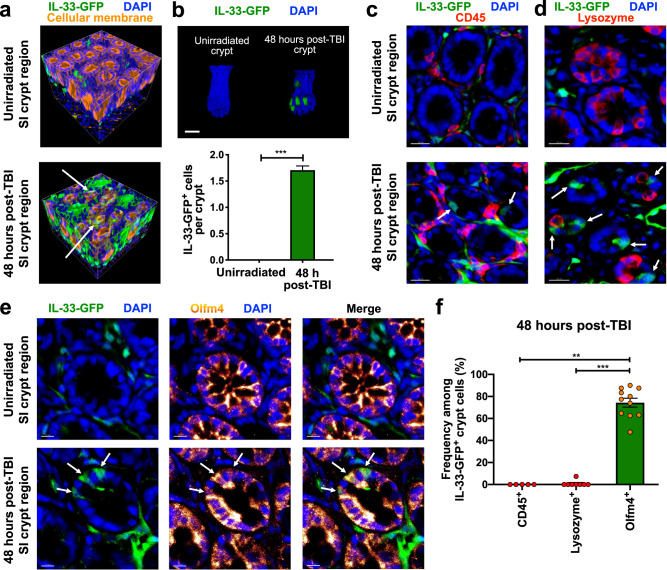
Fig. 2. Intestinal stem cells produce IL-33 in response to radiation injury.
Full-thickness small intestine (ileum) from IL-33-GFP reporter mice imaged by three-dimensional (3-D) microscopy. a 3-D projections of IL-33-GFP+ cell localization (anti-GFP staining, green) during homeostasis and 48 h after total body irradiation (TBI). Cellular membrane (DiD lipophilic dye staining, orange) and nuclear signals (DAPI staining, blue) indicate tissue architecture. b Representative 3-D images of crypts and quantification of IL-33-GFP+ cells at baseline and 48 h after TBI (n = 379 crypts/group at baseline, n = 476 crypts/group after TBI); scale bar: 25 μm. c 2-D optical slices from 3-D imaging of crypt regions with anti-CD45 staining for hematopoietic cells including lymphocytes (red); scale bars: 20 μm. d 2-D optical slices from 3-D imaging of crypt regions with staining for Paneth cells (anti-lysozyme, red); scale bars: 20 μm. e 2-D optical slices from 3-D imaging of crypt regions with staining for Olfm4+ ISCs (anti-Olfm4, orange glow); scale bars: 10 μm. f CD45+, lysozyme+, and Olfm4+ frequencies in IL-33-GFP+ crypt cells 48 h after TBI; n = 5 (CD45+), n = 8 (lysozyme+), and n = 11 (Olfm4+) independent 3-D fields. Arrows in (a) and (c–e) indicate IL33-GFP+ crypt cells. Statistical analyses were performed using a two-tailed Mann-Whitney U test (b) or Kruskal-Wallis multiple comparison testing (f). Bar graphs show means, and error bars indicate SEM (b, f); **p < 0.01 and ***p < 0.001. Source data for graphs are provided in the Source Data file. The exact p-values are as follows: (b) Unirradiated vs post-TBI, p < 0.0001; (f) Olfm4+ vs Lysozyme+, p < 0.0001; Olfm4+ vs CD45+ p = 0.0014.

