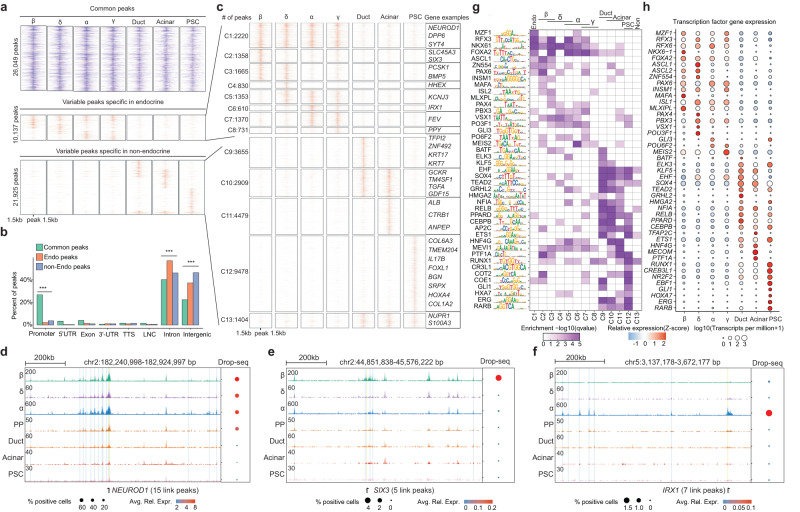
Fig. 2. Human islet cell-type-specific chromatin accessibility landscape.
a Heatmap displaying 58,111 open chromatin peaks that are accessible in at least one of the 7 islet cell types. All peaks are classified into three groups: common peaks that are open in all 7 cell types; endocrine-specific peaks, and non-endocrine-specific peaks. 3 kb around the open chromatin peaks are displayed. b Percentage of peaks located in each chromatin category: Promoters, 5’- untranslated regions(5’-UTRs), Exons, 3’-untranslated regions (3’-UTRs), Transcription termination sites (TTSs), LincRNAs (LNC), Intron, and intergenic regions. ***p values < 0.001, two-sided Fisher’s exact test. c k-means clustering for endocrine-specific peaks(C1 ~ C8) and non-endocrine-specific peaks(C9 ~ C13). Example genes with promoter peaks of different clusters are shown. d–f Genome browser snapshot of example loci of specific genes. Each track (row) shows aggregated peaks from single nuclei of each clustered cell type. On the right is the bubble plot that shows the aggregated RNA expression level (Drop-Seq Data) for each cell type. Avg.Rel.Expr (color gradient) indicates the average relative expression. % positive cells (bubble size) indicate the percentage of cells that show non-zero expression of the given gene. Three gene loci are shown: NEUROD1 (d), SIX3 (e), IRX1 (f). g, h Cell-type specific transcription factor activity. The transcription factor motif enrichment in each of the 13 peak clusters in (g), and the corresponding transcription factor gene expression level by Drop-Seq in (h).

