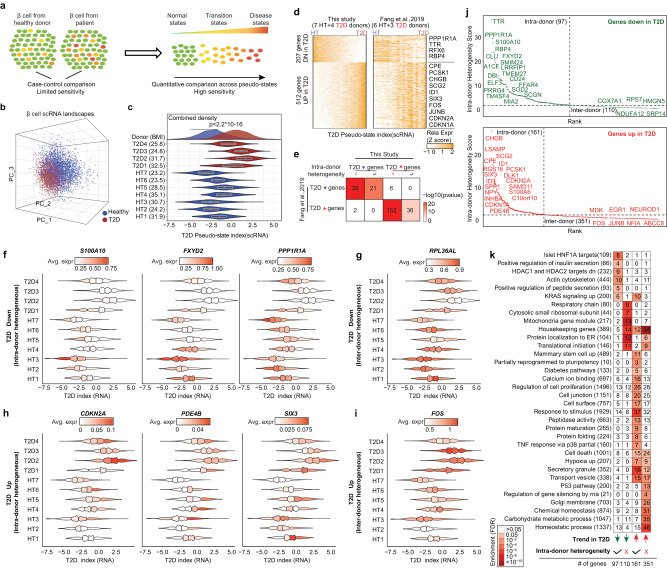
Fig. 4. RNA-RePACT dissects the T2D-associated transcriptomic heterogeneity in β-cells.
a Schematics showing the idea of RePACT. A trajectory-based method can improve the sensitivity of disease gene identification if a disease-associated β-cell heterogeneity exists. b Plot all β-cells from the scRNA-seq data in the top 3 principal components spaces. Blue or red color indicates whether the cells are from healthy or T2D donors. c After building a β-cell T2D trajectory with RePACT using PC1-PC10 (Methods), the violin plot (median ± upper and lower quartiles) compares the distribution of T2D pseudo-index for β-cells from each donor. Density plot (top) compares all β-cells from healthy (n = 7) or T2D donors (n = 4) with p-value (two-sided Kolmogorov-Smirnov test). d Left heatmap: the expression changes of the top up/downregulated genes along the T2D trajectory. Right heatmap: the expression changes of the same genes in a previously published cohort of β-cells. e reproducibility of intra-donor or inter-donor heterogeneity genes from this study compared to previously published study. Color intensity indicates the odds ratio. P values (two-sided Fisher’s exact test) and the numbers of genes are shown in the squares. f–i Examples of T2D trajectory genes with intra- and inter-donor heterogeneity. Each violin plot still shows the distribution of T2D index of β-cells in all donors in the same way as (c) but with additional information on the expression of denoted gene. In every violin, cells are binned into 4 subpopulation-quartiles according to the T2D index. Normalized gene expression is visualized in each violin quartile. Color scale indicates averaged expression level. Examples of four categories of genes are: f T2D-downregulated intra-donor heterogeneous genes; g T2D-downregulated inter-donor heterogeneous genes; h T2D-up-regulated intra-donor heterogeneous genes; i T2D-up-regulated inter-donor heterogeneous genes. j Ranking genes based on if they show consistent intra-donor heterogeneity. Y-axis indicates the significance from Fisher’s method after integrating p-values (two-sided t-test) from RePACT analyses of every individual donor using T2D trajectory (Methods). T2D-down intra-donor heterogeneous genes (n = 97); T2D-down inter-donor heterogeneous genes (n = 110); T2D-up intra-donor heterogeneous genes (n = 161); T2D-up inter-donor heterogeneous genes (n = 351). Dash lines indicate a cutoff of 2 (integrated p-value < 0.01) to classify the genes, examples in (f–i). k GSEA analysis for the four categories of T2D trajectory genes. Total number of genes of each function term is shown by each row, and the gene number in a tested category is shown in the square.

