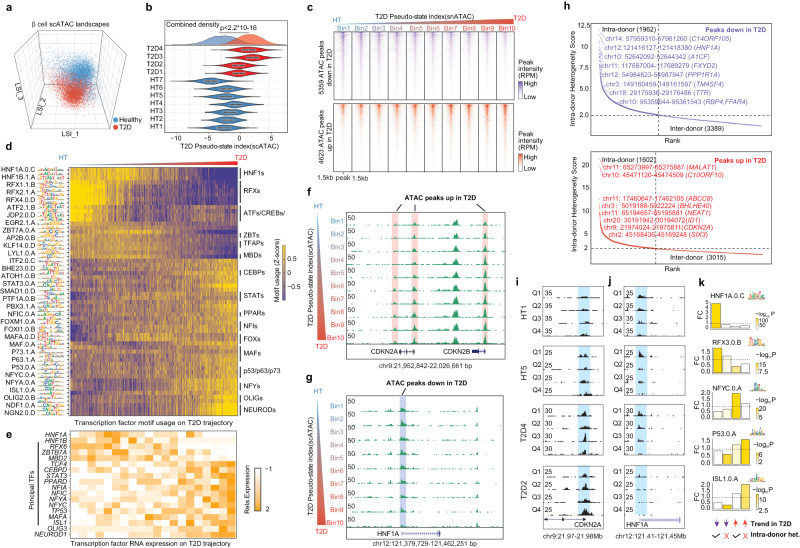
Fig. 5. ATAC-RePACT dissects the T2D-associated epigenomic heterogeneity in β-cells.
a Plot all β-cells from snATAC-seq data in the top 3 latent semantic indexing (LSI) spaces. Cells are colored based on whether the donor is healthy or T2D. b Like Fig. 4c, compare the distribution of the T2D pseudo-state index derived from snATAC (T2D trajectory-snATAC) of each donor (7 healthy donors, 4 T2D donors). P value is from two-sided Kolmogorov-Smirnov test. The T2D trajectory (snATAC) is computed from the regression analysis using LSI1-LSI10 (Methods). Violin plots show median ± upper and lower quartiles. (Two sided Kolmogorov-Smirnov test was performed to calculate p-value) c Heatmap displaying the ATAC peaks that are variable along the T2D trajectory. All β cells are binned into 10 bins along the T2D trajectory for visualization. 3 kb around the open chromatin peaks are displayed. (d) Transcription factor motif usage (Z-score) along the T2D trajectory in β-cells. The motif usage is computed at single-cell level with chromVAR (Methods). Selected motifs are shown. e Transcription factor gene expression change on T2D trajectory from RNA-RePACT analysis. f, g Genome browser snapshots of peaks that are losing or gaining accessibility along the T2D trajectory. Single cells from snATAC-seq data are grouped into 10 bins along the T2D trajectory. Each track (row) is a pseudo-bulk ATAC-seq track of one bin of cells. CDKN2A gains ATAC peak (f) and HNF1A loses ATAC peak (g). h Like in Fig. 4j, we also rank T2D-regulated ATAC peaks based on their scores of intra-donor heterogeneity. Dashed lines indicate the cutoff to define four categories of peaks: T2D-down intra-donor heterogeneous peaks (n = 1962); T2D-down inter-donor heterogeneous peaks (n = 3389); T2D-up intra-donor heterogeneous peaks (n = 1602); T2D-up inter-donor heterogeneous peaks (n = 3015). i, j Example of the intra-donor heterogeneous peak at CDKN2A and HNF1A promoters. For each donor, the β cells from snATAC-seq data are binned into four quartile subpopulations according to the ATAC T2D-pseudo-index; each panel shows the pseudo bulk ATAC-seq tracks of the four quartiles. k Transcription factor motifs enriched in the four categories of ATAC peaks, color of the boxes indicates the significance of enrichment from two-sided Fisher’s exact test.

