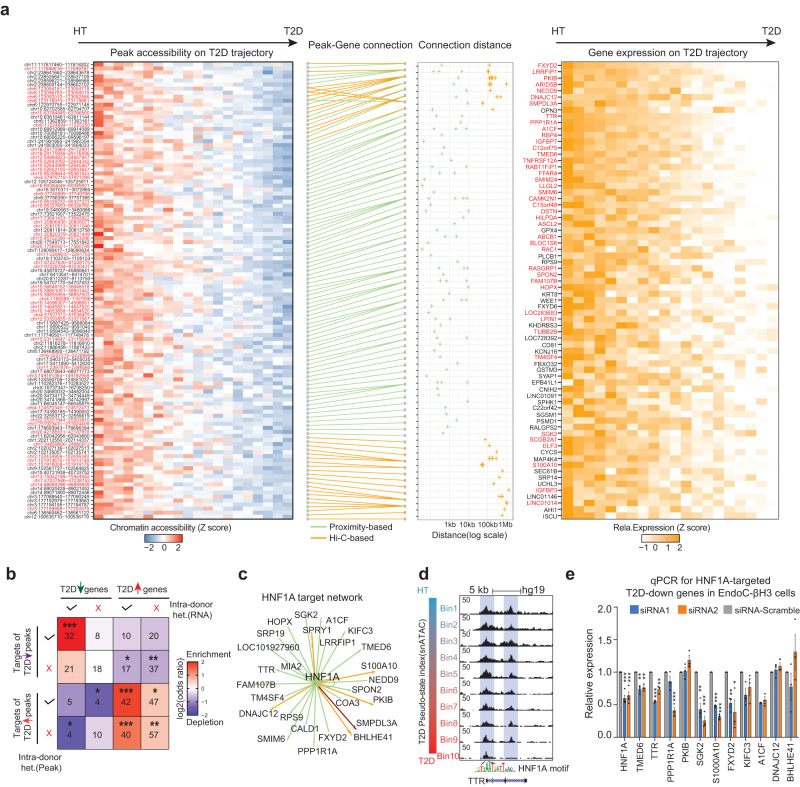
Fig. 6. Multiomic reconstruction of the T2D gene regulatory circuits in β-cells.
a Connect T2D downregulated ATAC peaks to downregulated genes from RePACT analyses through multiomic integration (T2D upregulated peak-gene pair in Supplementary Fig. 4). Leftmost panel: heatmap of peaks losing accessibility along T2D trajectory; peak locations (hg19) are on the left of each row. Peaks highlighted in red show intra-donor heterogeneity. Second panel shows the peak-gene connections. Green lines: peaks within 10 kb of the TSS; orange lines: distal peak-gene pairs supported by Hi-C loops. Third panel: the distance of each peak-TSS connection. Rightmost panel: heatmap of T2D downregulated genes. Red-highlighted gene names indicate intra-donor heterogeneous genes. b Enrichment analysis between T2D trajectory genes and T2D-trajectory peaks. Color intensity indicates the odds ratio. P values (two-sided Fisher’s exact test) and the numbers of genes are shown in the squares. c A subnetwork of predicted T2D downregulated genes controlled by HNF1A (Methods). Green lines: peaks within 10 kb of the TSS; orange lines: distal peak-gene pairs supported by Hi-C loops. Maroon: both proximal and distal peaks. d Genome browser snapshot of TTR locus (chr18:29,169,915-29,180,800) which is a putative HNF1A target. e qPCR validation of selected HNF1A targets following HNF1A knock-down. P-values are from two-sided paired t-test. ∗∗∗p < 0.0005, ∗∗p < 0.005, ∗p < 0.05 (three biological replicates each, HNF1A has four biological replicates. Each biological replicate is the average of three technical replicates). Data are presented as mean values +/− SEM.

