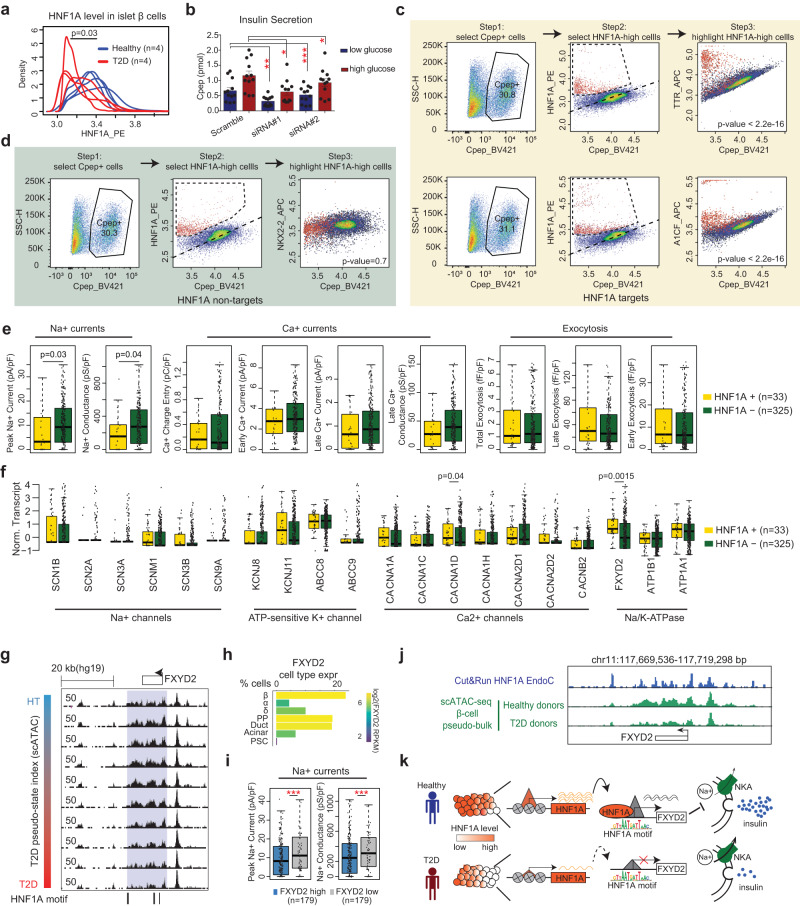
Fig. 7. Intra-donor heterogeneity of HNF1A and its target genes.
a The distribution of HNF1A level from flow cytometry analyses in β cells from four healthy islets (blue) and four T2D islets (red). Statistical significance determined via two-sided Wilcox test. b Glucose stimulated insulin secretion in HNF1A siRNA knock-down EndoC-βH3 cells or scrambled siRNA control cells. C-peptide levels in low glucose (2.8 mM) and high glucose (20 mM) conditions. Statistical significance was determined using paired two-sided t-test from n = 12 wells collected from four separate experiments by comparing corresponding glucose conditions to each other. *p-value < 0.05, **p-value < 0.005, ***p-value < 0.0005. Data are presented as mean values +/− SEM. c, d Three-way flow cytometry analysis of β-cells. Left panel: we first select the β-cells (C-pep+). Middle panel: HNF1A-high β-cells (highlighted in red) can be determined from the HNF1A vs. C-pep scatter plots. Right panel: for the β-cell population, we plot the gene of interest against C-pep in a scatter plot, HNF1A-high cells are highlighted in red. Examples of HNF1A target genes TTR and A1CF are shown in (c); Example of HNF1A non-target gene NKX2-2 is shown in (d). In the right panels, one sided t.test is used to measure the difference of target gene expression between HNF1A high cells and the rest of the cells. e Compare the electrophysiological measurements of exocytosis and channel activity in HNF1A + β cells (n = 33) and HNF1A- β cells (n = 325) from Patch-seq data, p-values from two-sided Wilcox test. Boxplots show median ± upper and lower quartiles. f Compare channel gene expression in HNF1A+ and HNF1A- β cells in Patch-seq data (Methods). p-value from two-sided Wilcox test. Boxplots show median ± upper and lower quartiles. g Browser snapshot of FXYD2 locus (chr11:117,660,352-117,716,145) with HNF1A motifs indicated. Same as Fig. 5f–g, each track (row) is a pseudo-bulk ATAC track of one bin of cells (out of 10) on the T2D trajectory. h FXYD2 expression in pancreatic islet cell types from the scRNA-seq data. i Na+ current measurements in FXYD2 high (n = 179) and FXYD2 low cells (n = 179) from Patch-seq data. ***p-value < =0.0005, two-sided Wilcox test. Boxplots show median ± upper and lower quartiles. j Genome browser snapshot of FXYD2 locus with HNF1A Cut&Run (blue) and pseudo-bulk ATAC track in β cells from T2D and healthy donors (green). k A schematic to show the role of HNF1A in β-cell heterogeneity and T2D. HNF1A expression has cell-to-cell variation in β-cells and is lower in T2D. HNF1A regulates FXYD2, an inhibitor of the Na+/K+-ATPase (NKA). FXYD2 decreases NKA’s affinity for Na+ ions and promotes depolarization and insulin secretion.

