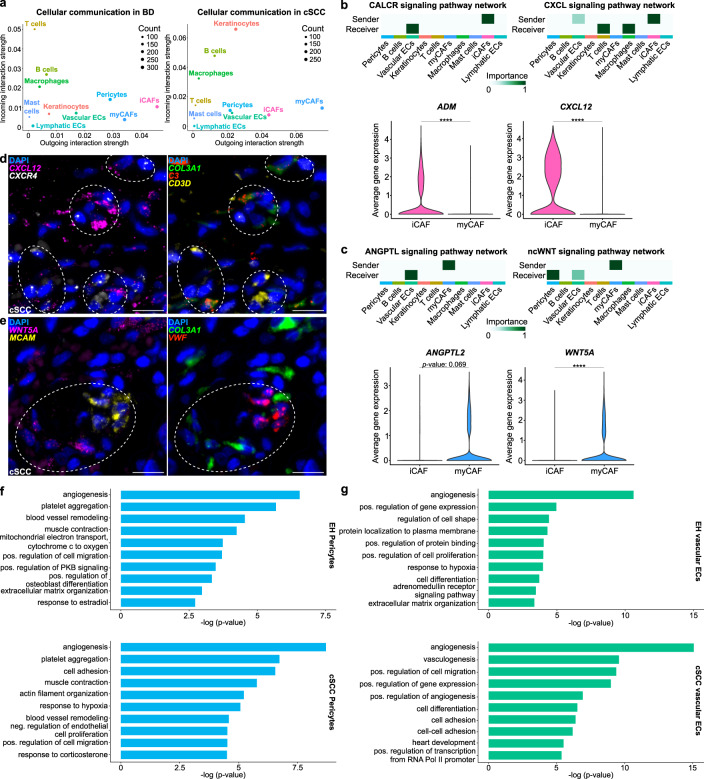
Fig. 4. Cutaneous iCAFs and myCAFs interact with different cell types to establish a pro-tumorigenic tumor microenvironment during cSCC development.
a Scatter plots visualizing the outgoing and incoming interaction strength (X-axes and Y-axes, respectively) between the different cell types in BD (left) and cSCC (right) samples. b and c Upper rows: heatmaps showing the prediction of the most important “sender” and “receiver” cell types within the cSCC tissue for different signaling pathway networks. White or light green correlates with no or low involvement, while dark green represents high importance. Bottom rows: violin plots representing the average gene expression of the most important ligands secreted by CAFs. Statistical analyses were performed using a two-sided Wilcoxon Rank Sum test (ADM: p value < 2.2e-16, CXCL12: p value < 2.2e-16, WNT5A: p value < 2.2e-16, ****: p value < 0.0001). d Representative microscopy image of a FFPE section from a cSCC sample (n = 2 patients) hybridized with fluorescent probes against the mRNA of CXCL12 (magenta), encoding an iCAF-derived ligand, CXCR4 (white), encoding a receptor on T cells, COL3A1 (green) as general CAF marker, C3 (red) as an iCAF marker gene and CD3D (yellow) as a T cell marker. Nuclei were counterstained with DAPI. Dashed circles highlight interaction areas. Scale bar: 25 µm. e Representative microscopy image of a FFPE section from a cSCC sample (n = 2 patients) hybridized with fluorescent probes against the mRNA of WNT5A (magenta), encoding a myCAF-derived ligand and used as myCAF marker gene, MCAM (yellow), encoding a receptor on vascular ECs, COL3A1 (green) as general CAF marker, and VWF (red) as a marker for vascular ECs. Nuclei were counterstained with DAPI. Dashed circles highlight interaction areas. Scale bar: 25 µm. f and g Top 10 terms from Gene Ontology (GO) analyses with the most representative expressed genes of pericytes (f) and vascular ECs (g) in chronically UVR-exposed healthy skin and cSCC samples. Terms are ordered according to p value, determined by the Fisher’s Exact test. EC endothelial cell, iCAF inflammatory cancer-associated fibroblast, myCAF myofibroblastic cancer-associated fibroblast, UVR ultraviolet radiation, EH UVR-exposed healthy, cSCC cutaneous squamous cell carcinoma. Source data are provided as a Source Data file.

