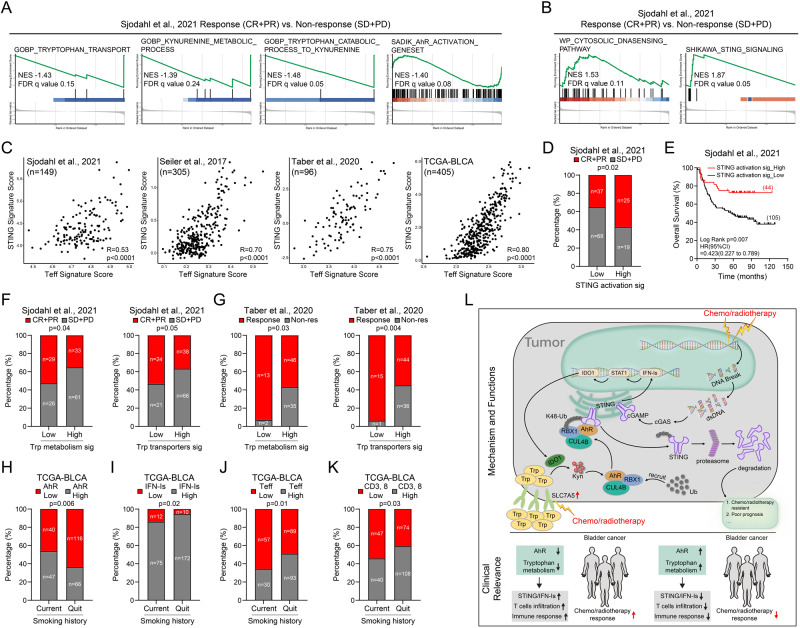
Fig. 8. Trp metabolism-AhR-STING pathway affects the efficacy of NAC in BC patients.
A, B GSEA plot shows downregulation and upregulation pathway genes in NAC response samples compared to non-response samples. C The correlation between Teff signature expression and STING activation signature expression22,23,46. D The correlation between NAC response rate and STING activation signature expression23. E Kaplan–Meier survival curves of patients with low and high STING activation signature expression23. F, G The correlation between NAC response rate and Trp metabolism signature or Trp transporters signature expression23,46. H–K The correlation between smoking history and AhR activation (H), IFN-Is signaling (I), Teff expression (J), CD3,8 expression (K). L The signaling transduction pathways and clinical relevance were illustrated. The correlation coefficient and two-tailed p value were calculated using Pearson’s correlation analysis (C). P value by Pearson’s chi-square test (D, F–K). P value by Kaplan–Meier survival analysis (E). AUC was used to determine the optimal cutoff. All p value < 0.05 as statistic difference. Source data are provided as a Source Data file.

