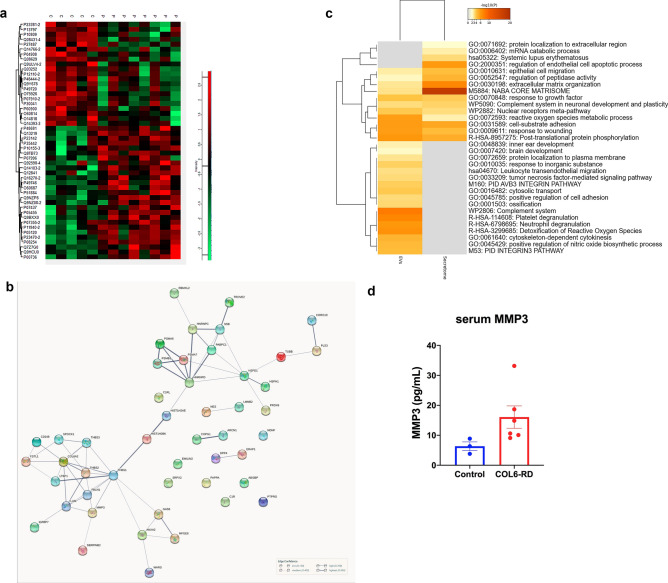
Figure 5.
(a) Heatmap showing the expression levels of the DA proteins across control and patient samples. (b) Analysis of the secretome showing the protein–protein network of the 48 differentially abundant proteins in COL6-RD derived fibroblasts versus healthy fibroblasts. (c) Comparative meta analysis of the most overrepresented functional categories amongst the DA proteins in EVs versus those in the secretome (Metaescape). (d) Results of the MMP3 ELISA showing an increased concentration in serum from COL6-RD serum (mean values and SEM).

