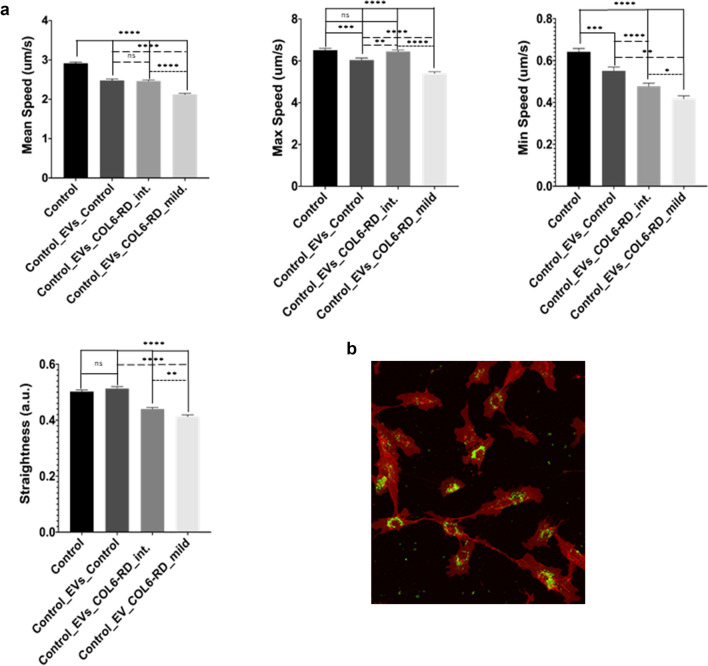
Figure 6.
(a) Results of cell tracking assay showing the mean, maximum (max) and minimum (min) speed of control cells either untreated or treated with EVs derived from control fibroblasts, EVs derived from a COL6-RD muscular dystrophy patient with an intermediate phenotype and a COL6-RD muscular dystrophy patient with a mild phenotype. Continuous lines represent comparisons with untreated control fibroblasts, dashed lines with control cells treated with EVs derived from control fibroblasts and dotted lines between control cells treated with EVs from either mild or intermediate COL6-RD fibroblasts. * p < 0.05, ** p < 0.01, *** p < 0.001, **** p < 0.0001 (b) Representative image of labelled EV´s incorporation in control fibroblasts in vivo.

