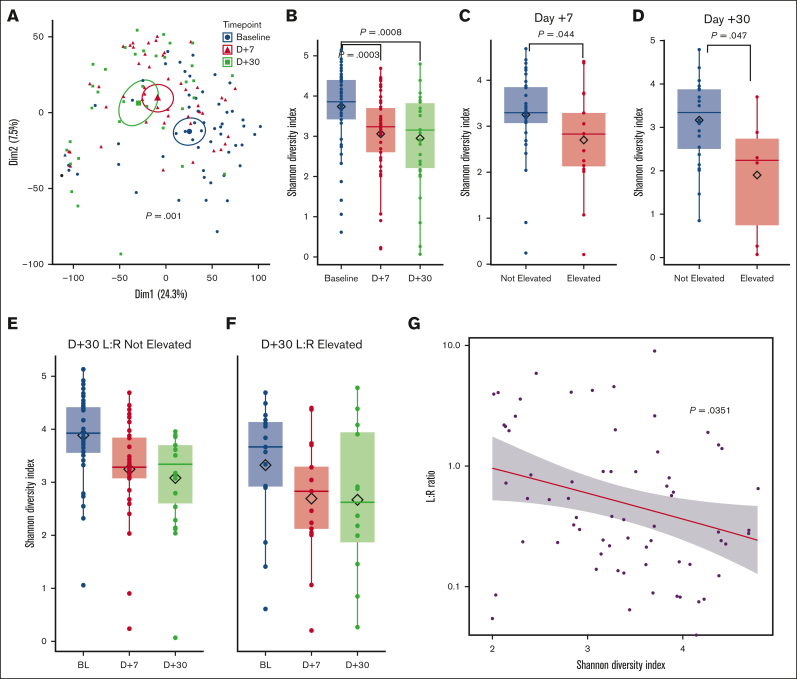
Figure 4.
Microbiome diversity in intestinal permeability cohort. (A) Principal component analysis of intestinal microbiome composition from stool samples at baseline ([BL], blue), day +7 ([D+7], red), and day +30 ([D+30], green). Colored ellipses represent the 95th percentile for the mean composition of the samples grouped by timepoint. (B) Alpha diversity of study cohort before, during, and after transplant. Alpha diversity at (C) day +7 and (D) day +30 grouped by intestinal permeability as elevated (red) or not elevated (blue). Trajectory of alpha diversity during transplant in (E) participants with normal day +30 L:R ratio and (F) participants with abnormally elevated day +30 L:R ratio. (G) Linear regression model of log (L:R ratio) and alpha diversity.

