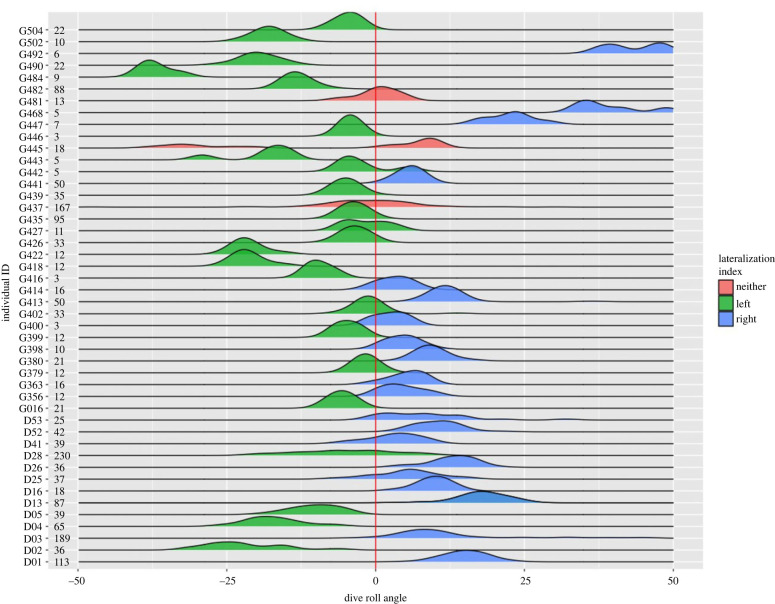
Figure 2.
Distribution of roll in pre-dive behaviour for gannets tagged with accelerometers. The red line crosses through 0 where non-lateralized individuals would be expected to be distributed. Gannet ID is labelled on the left axes followed by number of dives recorded, with density distribution shown for each animal. Distributions are coloured to represent the designation of ‘left’, ‘right’, or ‘neither’ as described by the LI. Distributions are presented as geom_density functions form the ggplot2 and ggridge packages in R [43,44]. These are kernel density estimates and can be considered as smoothed versions of histograms and are designed to provide a non-binned density distribution of continuous data and have scales relevant to the number of dives for each bird.

