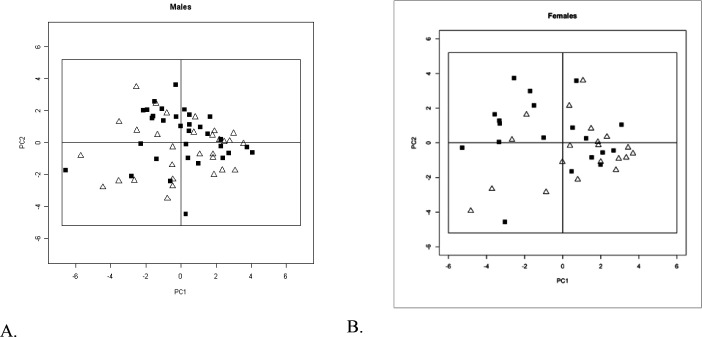
Figure 1.
Scatter plot of male and female participants on PC1 on PC2.
Note. A. Male participants. B. Female participants. Black squares represent individuals who reported ages at first sexual intercourse at 16 years (median) or less and open triangles represent individuals who reported ages at first sexual intercourse after age 16 years.

