
Figure 8.
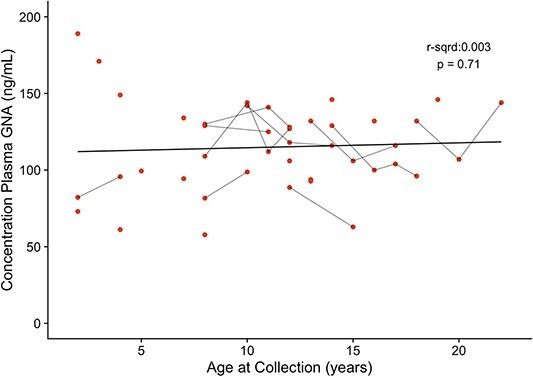
Plasma GNA concentration vs. age at collection for participants as measured over time. Age at sample collection and GNA concentration were compared to determine whether there was a significant relationship. The line is the trend line with statistical correlation shown. Each point represents a measurement, and points connected by short black lines are consecutive measurements for the same participant.