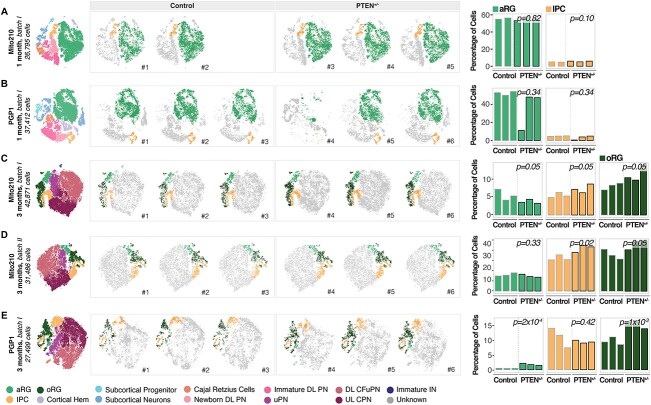
Figure 1.
oRG are consistently affected in PTEN mutant organoids independently of genetic background. (A–E) Left: t-SNE plots of scRNA-seq data, color-coded by cell type, from 1-month Mito210 control and PTEN heterozygous mutant organoids (Mito210 control n = 2, Mito210 heterozygous n = 3) (A), 1-month PGP1 control and PTEN heterozygous mutant organoids (n = 3 single organoids per genotype) (B), 3-month Mito210 control and PTEN heterozygous mutant organoids (n = 3 single organoids per genotype; batch I) (C), 3-month Mito210 control and PTEN heterozygous mutant organoids (n = 3 single organoids per genotype; batch II) (D) and 3-month PGP1 control and PTEN heterozygous mutant organoids (n = 3 single organoids per genotype) (E). Middle: t-SNE plots for individual control and mutant organoids, with cell types of interest highlighted in color: apical radial glia (aRG, light green), intermediate progenitor cells (IPC, yellow) and oRG (dark green). Right: bar charts showing the percentage of cells for the highlighted cell populations in each control and mutant organoid. FDRs for a difference in cell type proportions between control and mutant, based on logistic mixed models (see Materials and Methods) are shown. aRG, apical radial glia; DL, deep layer; UL, upper layer; PNs, projection neurons; oRG, outer radial glia; IPCs, intermediate progenitor cells; CPNs, callosal projection neurons; CFuPNs, corticofugal projection neurons; uPNs, unspecified PN; INs, interneurons.

