Figure 1.
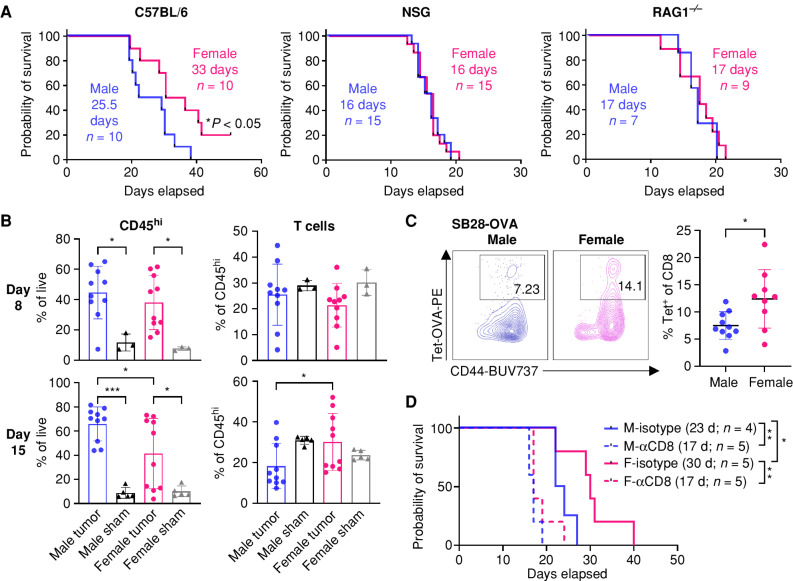
T cells drive sex differences in GBM survival. A, Survival analysis was performed after intracranial injection of the mouse GBM cell line SB28 in immunocompetent B6 mice (15,000 cells/injection) and immune-deficient NSG (10,000 cells/injection) and RAG1−/− mice (15,000 cells/injection). Median survival days and number of animals are indicated in the graph. Data combined from two to three independent experiments. Statistical significance was determined by log-rank test, considering P < 0.05 to be significant. B, Frequency of CD45hi immune cells and CD3+ T cells from the tumor-bearing left hemisphere of SB28-injected mice or the left hemisphere of the sham-injected group on days 8 and 15. Data are shown as mean ± SD from two independent experiments. n = 10 for SB28-bearing mice and n = 3–5 for sham-injected mice. One-way ANOVA with the Tukey multiple comparisons test was performed to determine statistical significance (*, P < 0.05; ***, P < 0.001). C, Frequency of OVA-specific CD8+ T cells was measured using tetramer (Tet) antibody from the tumor-bearing left hemisphere of SB28-OVA (25,000 cells/mouse)–injected B6 wild-type mice on day 14 after tumor implantation. Data are shown as mean ± SD from two independent experiments. n = 9–10/group. *, P < 0.05 was determined by an unpaired t test. D, Kaplan–Meier curves depicting survival of SB28-bearing male and female mice treated with anti-CD8–depleting antibody. Log-rank test was performed to determine statistical significance (*, P < 0.05; **, P < 0.01). d, days; F, female; M, male.

