. 2023 Jun 28;13(9):2090–2105. doi: 10.1158/2159-8290.CD-22-0869

Figure 2.

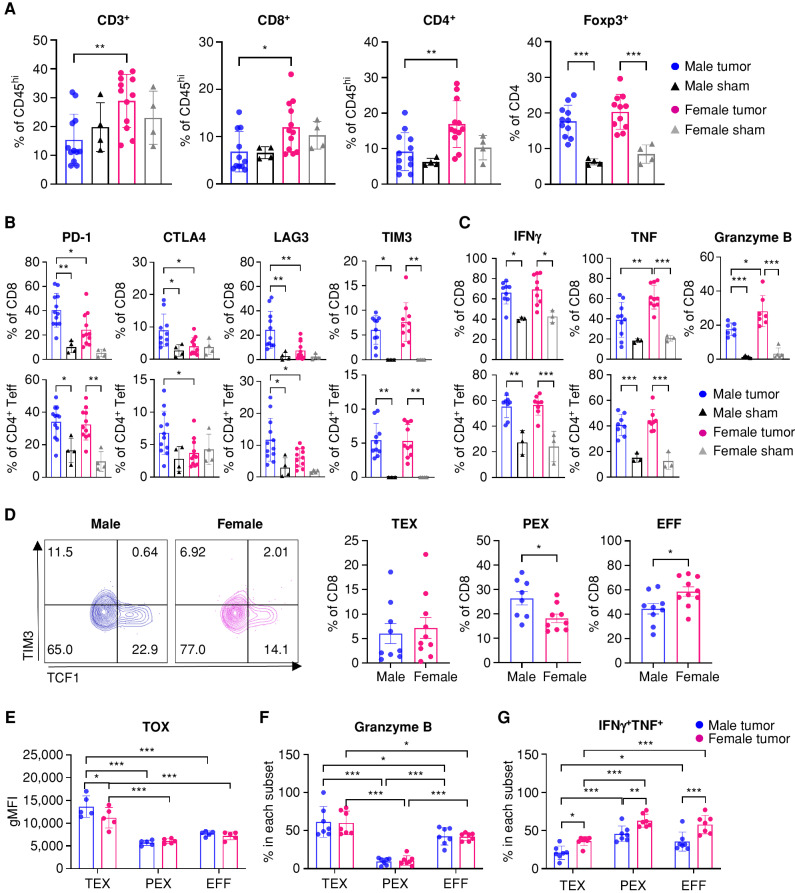
Figure 2. More male CD8+ T cells are functionally exhausted and skewed toward a progenitor exhausted T-cell phenotype. Tumor-infiltrating T cells were analyzed on day 15 after implantation of SB28 tumor cells. A, Frequency of T-cell subsets in CD45hi immune cells. Data are combined from two independent experiments. n = 11–12 for the SB28-injected group and n = 4 for the sham-injected group. B, Inhibitory receptor expression in CD8+ and CD4+Foxp3− effector T cells (Teff). Data are combined from two independent experiments. n = 10–12 for the SB28-injected group and n = 4 for the sham-injected group. C, Intracellular cytokine expression in CD8+ and CD4+Foxp3− effector T cells was measured after ex vivo stimulation. Data are combined from two independent experiments. n = 7–10 for the SB28-injected group and n = 3 for the sham-injected group. D, Exhausted T-cell subsets in CD8+ T cells: TEX (CD8+CD44+PD-1+TCF1−TIM3+), PEX (CD8+CD44+PD-1+TCF1+TIM3−), and EFF (CD8+CD44+TCF1−TIM3−). Data are combined from two independent experiments. n = 9–10 for the SB28-injected group and n = 4 for the sham-injected group. E, TOX expression in each CD8+ T-cell subset. gMFI, geometric mean fluorescence intensity. Intracellular expression of granzyme B (F) and IFNγ+TNF+ (G) in each CD8+ T-cell subset after ex vivo stimulation. Data are combined from two independent experiments. n = 5–7 for SB28-injected group. Two-way ANOVA with the Tukey multiple comparisons test (A–C and E–G) or unpaired Student t test (D) was performed (*, P < 0.05; **, P < 0.01; ***, P < 0.001).

More male CD8+ T cells are functionally exhausted and skewed toward a progenitor exhausted T-cell phenotype. Tumor-infiltrating T cells were analyzed on day 15 after implantation of SB28 tumor cells. A, Frequency of T-cell subsets in CD45hi immune cells. Data are combined from two independent experiments. n = 11–12 for the SB28-injected group and n = 4 for the sham-injected group. B, Inhibitory receptor expression in CD8+ and CD4+Foxp3 effector T cells (Teff). Data are combined from two independent experiments. n = 10–12 for the SB28-injected group and n = 4 for the sham-injected group. C, Intracellular cytokine expression in CD8+ and CD4+Foxp3 effector T cells was measured after ex vivo stimulation. Data are combined from two independent experiments. n = 7–10 for the SB28-injected group and n = 3 for the sham-injected group. D, Exhausted T-cell subsets in CD8+ T cells: TEX (CD8+CD44+PD-1+TCF1TIM3+), PEX (CD8+CD44+PD-1+TCF1+TIM3), and EFF (CD8+CD44+TCF1TIM3). Data are combined from two independent experiments. n = 9–10 for the SB28-injected group and n = 4 for the sham-injected group. E, TOX expression in each CD8+ T-cell subset. gMFI, geometric mean fluorescence intensity. Intracellular expression of granzyme B (F) and IFNγ+TNF+ (G) in each CD8+ T-cell subset after ex vivo stimulation. Data are combined from two independent experiments. n = 5–7 for SB28-injected group. Two-way ANOVA with the Tukey multiple comparisons test (A–C and E–G) or unpaired Student t test (D) was performed (*, P < 0.05; **, P < 0.01; ***, P < 0.001).