. 2023 Jun 28;13(9):2090–2105. doi: 10.1158/2159-8290.CD-22-0869

Figure 3.

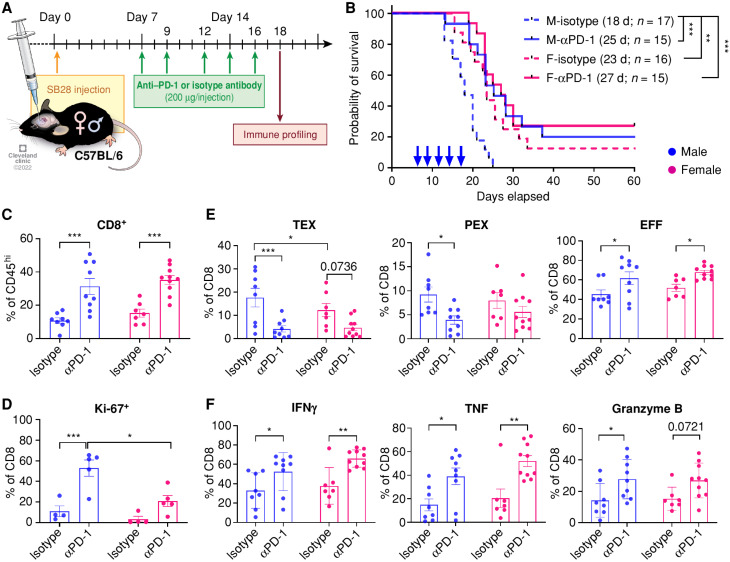
Figure 3. Males are more responsive to anti–PD-1 therapy. A, Schematics depicting treatment regimen for anti–PD-1 and immune profiling. B, Kaplan–Meier curves depicting survival of male and female SB28-bearing mice treated with anti–PD-1 or isotype antibodies (10 mg/kg) starting from day 7 after intracranial tumor implantation. Combined results from three independent experiments with log-rank test (**, P < 0.01; ***, P < 0.001). Median survival length and number of animals are indicated. d, days; F, female; M, male. C–F, Immunophenotyping was performed on tumor-infiltrating immune cells on day 18, 2 days after the last treatment. Data are combined from two independent experiments. n = 9–10 for the anti–PD-1 treatment group and n = 7–8 for the isotype antibody-treated group. C, Percentage of CD8+ T cells in CD45hi cells. D, Proliferation marker Ki-67 expression in CD8+ T cells. Data are shown as mean ± SD of n = 5/group from one of two independently repeated experiments. E, Frequency of exhausted T-cell subsets in CD8+ T cells: TEX, PEX, and EFF. F, Percentages of intracellular CD8+ T cells expressing IFNγ, TNF, and granzyme B. Two-way ANOVA with the Tukey multiple comparisons test was performed (*, P < 0.05; **, P < 0.01; ***, P < 0.001).

Males are more responsive to anti–PD-1 therapy. A, Schematics depicting treatment regimen for anti–PD-1 and immune profiling. B, Kaplan–Meier curves depicting survival of male and female SB28-bearing mice treated with anti–PD-1 or isotype antibodies (10 mg/kg) starting from day 7 after intracranial tumor implantation. Combined results from three independent experiments with log-rank test (**, P < 0.01; ***, P < 0.001). Median survival length and number of animals are indicated. d, days; F, female; M, male. CF, Immunophenotyping was performed on tumor-infiltrating immune cells on day 18, 2 days after the last treatment. Data are combined from two independent experiments. n = 9–10 for the anti–PD-1 treatment group and n = 7–8 for the isotype antibody-treated group. C, Percentage of CD8+ T cells in CD45hi cells. D, Proliferation marker Ki-67 expression in CD8+ T cells. Data are shown as mean ± SD of n = 5/group from one of two independently repeated experiments. E, Frequency of exhausted T-cell subsets in CD8+ T cells: TEX, PEX, and EFF. F, Percentages of intracellular CD8+ T cells expressing IFNγ, TNF, and granzyme B. Two-way ANOVA with the Tukey multiple comparisons test was performed (*, P < 0.05; **, P < 0.01; ***, P < 0.001).