. 2023 Jun 28;13(9):2090–2105. doi: 10.1158/2159-8290.CD-22-0869

Figure 4.

Figure 4. Immune cell–intrinsic and cell–extrinsic effect in GBM survival. A, A schematic of the generation of bone marrow chimera models. Immune profiling was performed from the tumor-bearing hemisphere on day 14 after tumor implantation (SB28, 10,000 cells/injection). i.c., intracranial. B, Frequency of T-cell subsets in CD45hi cells. Data are combined from four independent experiments. n = 8–18 per group. One-way ANOVA with the Tukey multiple comparisons test (*, P < 0.05; **, P < 0.01). C, Percentage of exhausted T-cell subsets in CD8+ T cells. Data are combined from three independent experiments. n = 4–11 per group. One-way ANOVA with Tukey multiple comparisons test (*, P < 0.05; **, P < 0.01). D, Kaplan–Meier curves depicting survival of bone marrow chimeras after intracranial injection of SB28 cells. Data are combined from three independent experiments. n = 23–25 per group. Statistical significance was determined by the log-rank test (*, P < 0.05; **, P < 0.01; ***, P < 0.001). d, days. E, Schematic showing the generation of mixed bone marrow chimera models. Immune profiling was performed from the tumor-bearing hemisphere on day 14 after tumor implantation (SB28, 10,000 cells/injection). F, Frequency of the PEX subset in male (CD45.1+) or female (CD90.1+) CD8+ T cells. Dotted line indicates cells from the same recipient. G, Ki-67 expression in male (CD45.1+) or female (CD90.1+) CD8+ T cells. Data are combined from two independent experiments. n = 6–7 per group. A paired t test was performed (*, P < 0.05; **, P < 0.01).

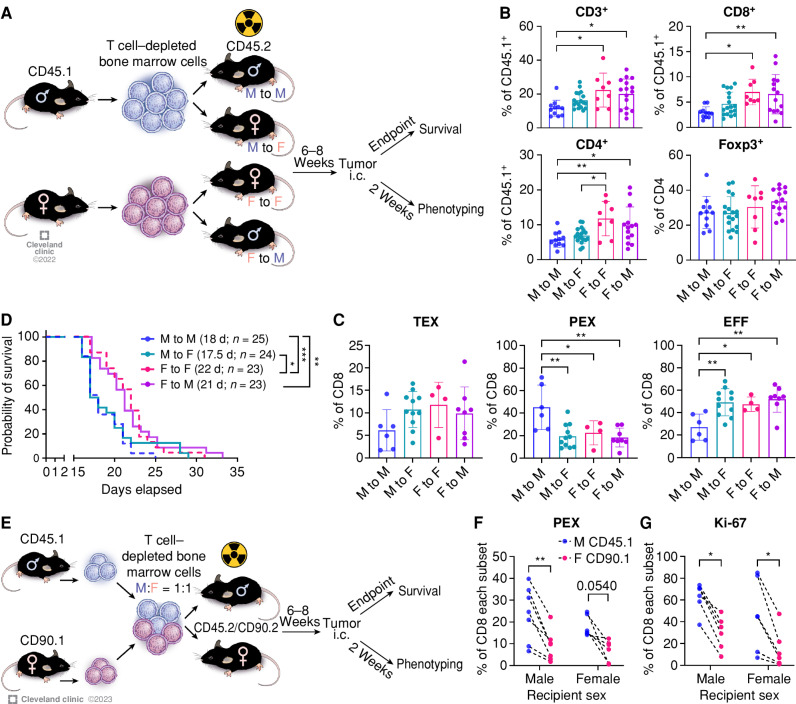
Immune cell–intrinsic and cell–extrinsic effect in GBM survival. A, A schematic of the generation of bone marrow chimera models. Immune profiling was performed from the tumor-bearing hemisphere on day 14 after tumor implantation (SB28, 10,000 cells/injection). i.c., intracranial. B, Frequency of T-cell subsets in CD45hi cells. Data are combined from four independent experiments. n = 8–18 per group. One-way ANOVA with the Tukey multiple comparisons test (*, P < 0.05; **, P < 0.01). C, Percentage of exhausted T-cell subsets in CD8+ T cells. Data are combined from three independent experiments. n = 4–11 per group. One-way ANOVA with Tukey multiple comparisons test (*, P < 0.05; **, P < 0.01). D, Kaplan–Meier curves depicting survival of bone marrow chimeras after intracranial injection of SB28 cells. Data are combined from three independent experiments. n = 23–25 per group. Statistical significance was determined by the log-rank test (*, P < 0.05; **, P < 0.01; ***, P < 0.001). d, days. E, Schematic showing the generation of mixed bone marrow chimera models. Immune profiling was performed from the tumor-bearing hemisphere on day 14 after tumor implantation (SB28, 10,000 cells/injection). F, Frequency of the PEX subset in male (CD45.1+) or female (CD90.1+) CD8+ T cells. Dotted line indicates cells from the same recipient. G, Ki-67 expression in male (CD45.1+) or female (CD90.1+) CD8+ T cells. Data are combined from two independent experiments. n = 6–7 per group. A paired t test was performed (*, P < 0.05; **, P < 0.01).