. 2023 Jun 28;13(9):2090–2105. doi: 10.1158/2159-8290.CD-22-0869

Figure 6.

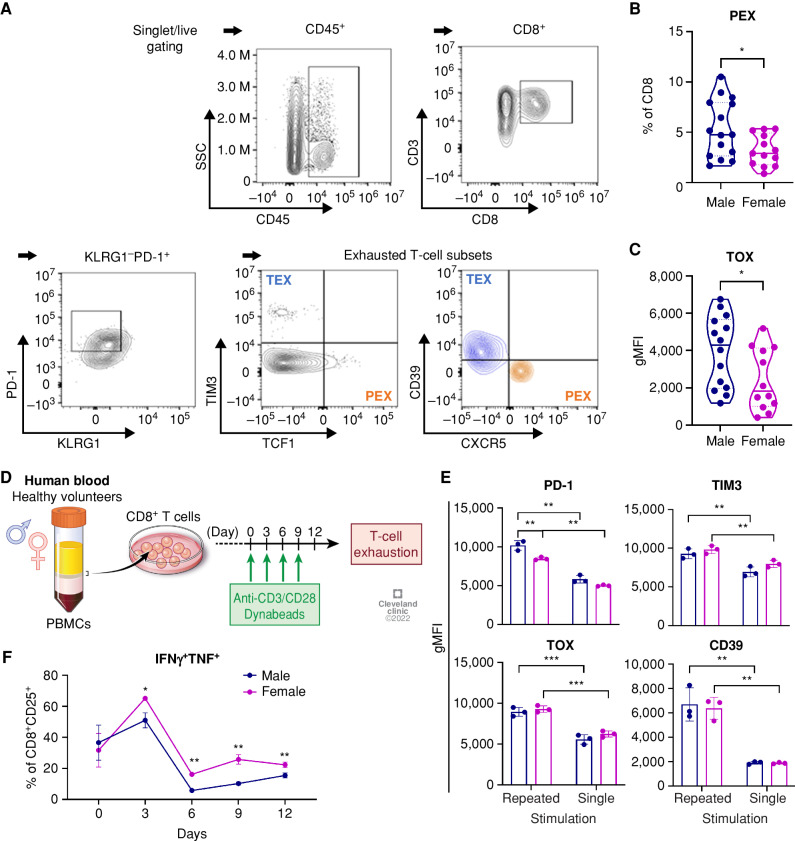
Figure 6. Sex differences in exhausted T cells in GBM patients. A, A gating strategy for exhausted T-cell subsets from GBM patient tumors. B and C, Frequency of PEX (CD8+KLRG1−PD-1+CXCR5−TCF1+TIM3−; B) and TOX expression (C) in CD8+ T cells from tumors of male (n = 18) and female (n = 14) patients with isocitrate dehydrogenase (IDH) wild-type GBM tumors. Unpaired t test (*, P < 0.05). gMFI, geometric mean fluorescence intensity. D, In vitro induction of exhaustion in human CD8+ T cells. E, Exhaustion marker expression in CD8+ T cells on day 12 after stimulation. Two-way ANOVA with Tukey multiple comparisons test (**, P < 0.01; ***, P < 0.001). gMFI, geometric mean fluorescence intensity. F, Intracellular expression of IFNγ+TNF+ in CD8+ T cells during repeated stimulation. Multiple unpaired t test was performed (*, P < 0.05; **, P < 0.01). Data are shown as mean ± SD (n = 3) and are representative of two independent experiments.

Sex differences in exhausted T cells in GBM patients. A, A gating strategy for exhausted T-cell subsets from GBM patient tumors. B and C, Frequency of PEX (CD8+KLRG1PD-1+CXCR5TCF1+TIM3; B) and TOX expression (C) in CD8+ T cells from tumors of male (n = 18) and female (n = 14) patients with isocitrate dehydrogenase (IDH) wild-type GBM tumors. Unpaired t test (*, P < 0.05). gMFI, geometric mean fluorescence intensity. D,In vitro induction of exhaustion in human CD8+ T cells. E, Exhaustion marker expression in CD8+ T cells on day 12 after stimulation. Two-way ANOVA with Tukey multiple comparisons test (**, P < 0.01; ***, P < 0.001). gMFI, geometric mean fluorescence intensity. F, Intracellular expression of IFNγ+TNF+ in CD8+ T cells during repeated stimulation. Multiple unpaired t test was performed (*, P < 0.05; **, P < 0.01). Data are shown as mean ± SD (n = 3) and are representative of two independent experiments.