Figure 3.
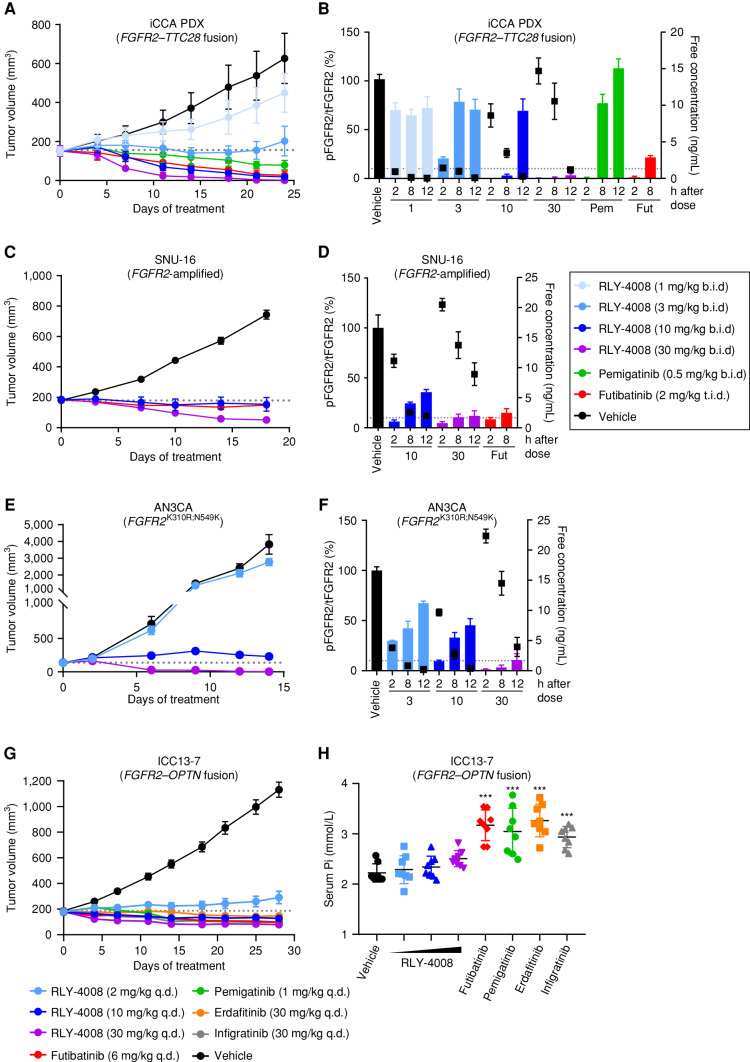
Treatment with RLY-4008 leads to dose-dependent inhibition of FGFR2 and tumor regression in multiple FGFR2-altered tumor models and spares FGFR1 in vivo. A–F, Refer to boxed legend. A, C, E, and G, Dotted line indicates tumor volume prior to initiation of treatment. B, D, and F, Dotted line indicates 10% pFGFR2/tFGFR2 (90% inhibition of pFGFR2). A, Antitumor activity of RLY-4008 compared with pemigatinib and futibatinib in an FGFR2–TTC28 iCCA patient-derived xenograft (PDX) model (n = 6/group). Data are mean ± SEM. B, Dose-dependent inhibition of FGFR2 in FGFR2–TTC28 tumors. Animals were sacrificed, and tumors were harvested at the indicated time points after the final dose on the third day of dosing. Tumor lysates were analyzed via pFGFR2 (Y653/654) ELISA and tFGFR2 HTRF; pFGFR2 normalized to tFGFR2 is reported (n = 3/group). Free plasma concentration of RLY-4008 is reported. Data are mean ± SEM. Fut, futibatinib; Pem, pemigatinib. C, Antitumor activity of RLY-4008 compared with futibatinib in the SNU-16 gastric cancer xenograft model (n = 7/group). Data are mean ± SEM. D, Dose-dependent inhibition of FGFR2 in SNU-16 tumors. Animals were sacrificed and tumors were harvested at the indicated time points after the final dose on the fourth day of dosing. Tumor lysates were analyzed via pFGFR2 (Y653/654) and tFGFR2 HTRF; pFGFR2 normalized to tFGFR2 is reported (n = 3/group). Free plasma concentration of RLY-4008 is reported. Data are mean ± SEM. E, Antitumor activity of RLY-4008 in the AN3CA endometrial cancer xenograft model (n = 8/group). Data are mean ± SEM. F, Dose-dependent inhibition of FGFR2 in AN3CA tumors. Animals were sacrificed and tumors were harvested at the indicated time points after the final dose on the third day of dosing. Tumor lysates and plasma were analyzed and reported as in B (n = 3/group). G, Antitumor activity of RLY-4008 and pan-FGFRi futibatinib, pemigatinib, erdafitinib, and infigratinib in an FGFR2–OPTN iCCA cell line–derived xenograft model, ICC13–7 (n = 8/group). Data are mean ± SEM. H, RLY-4008 spares FGFR1 in vivo. Two hours after the final dose of the study shown in G, blood was collected from all animals for serum phosphate analysis (n = 8/group). Data are mean ± SEM. ***, P < 0.0001, one-way ANOVA. b.i.d., twice daily; q.d., once daily; t.i.d., three times daily.

