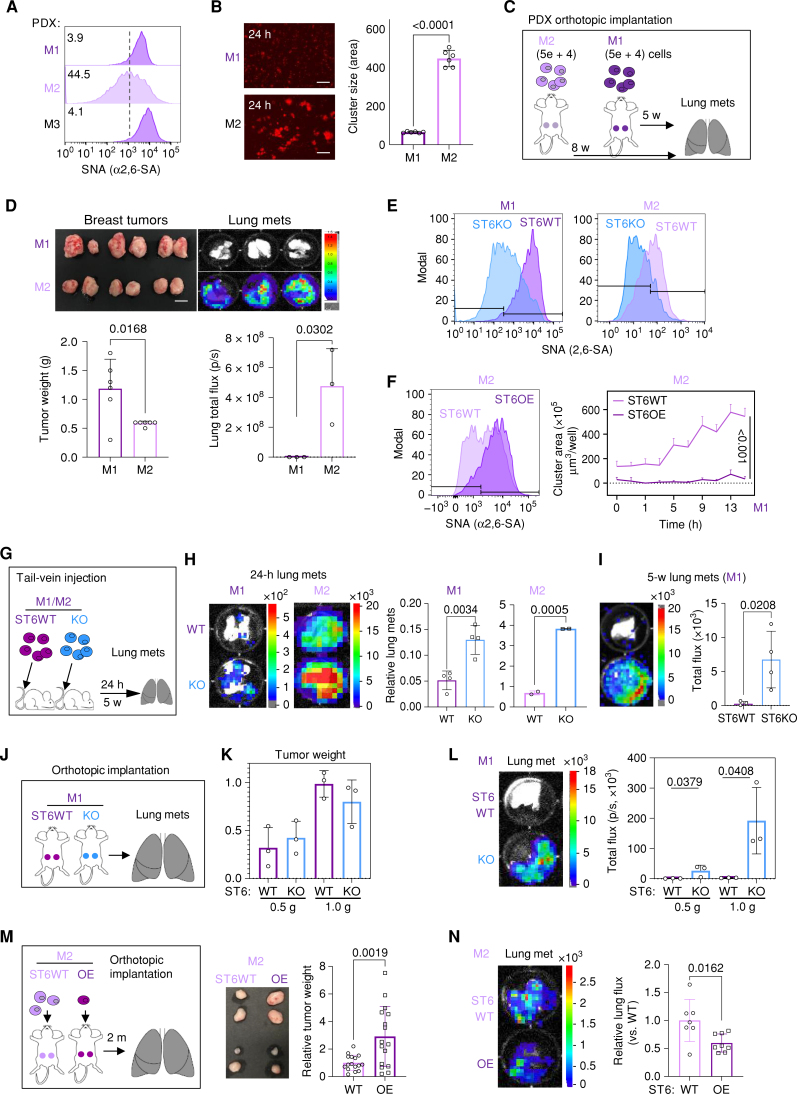
Figure 4.
ST6GAL1 inhibits cluster formation and blocks metastatic seeding in PDX models. A, Flow cytometry profiles of α2,6-SA (SNA) of indicated PDX models (M1, M2, and M3). B, Representative images (left) and quantification (right) of cluster size (area) of PDX-M1 (M1) vs. PDX-M2 (M2) tumor cells at 24 hours (scale bars = 300 μm). Data are represented as mean ± SD of 6 experimental replicates. C, Schematic design to analyze spontaneous metastases of M1 (−5 weeks) and M2 (−8 weeks) PDX tumor models: 5 × 10⁴ cells were orthotopically injected into the fourth mouse mammary fat pads. Five to 8 weeks after implantation, breast tumor weight and lung metastases (mets) were measured. D, Top: images of dissected tumors (scale bar = 1 cm) and lung metastases (bioluminescence) of M1 and M2 PDX models. Bottom: quantified tumor weight (g) and lung metastasis (bioluminescence imaging total flux). E, Flow cytometry profiles of α2,6-SA levels in ST6WT and ST6KO PDX-M1/M2 models. F, Flow cytometry profile of α2,6-SA levels (left) and cluster formation curves (right) in ST6WT and ST6OE cells derived from M2 PDXs. Curve data are represented as mean ± SD of 12 experimental replicates. G, Experimental illustration of tail-vein injection of ST6KO (KO) with appropriate ST6WT (WT) controls of PDX-M1 and PDX-M2 models; 1 × 10⁵ cells/mouse were injected via tail vein, and lung localization signals were measured 24 hours and/or 5 weeks after injection. H, Representative images (left) and quantification (right) of lung metastatic seedings of ST6WT vs. ST6KO M1 and M2 models 24 hours after injection. Lung total flux of cellular bioluminescence signals was imaged prior to and after injections. I, Lung bioluminescence images (left) and quantified lung metastases (photons/s; right) 5 weeks after tail-vein injection of ST6WT and ST6KO cells. J, Schematic illustration of orthotopic implantations of ST6WT and ST6KO PDX-M1 into the fourth mouse mammary fat pads. Two batches of ST6WT (1.2 × 10³ cells/injection) and ST6KO (5 × 10³ cells/injection) cells were injected, and tumors were harvested when reaching ∼0.5 g or 1.0 g. K, Quantified tumor weight for both ST6WT and ST6KO M1 tumors collected at various time points. L, Representative bioluminescence images (left) and quantified lung metastasis (right) of ST6WT and ST6KO PDX-M1 models at 0.5 g and 1.0 g, respectively. Data, mean ± SD of 8 experimental replicates. M, Schematic of orthotopic implantations of ST6WT (6 × 10⁴ cells) and ST6OE (2 × 10⁴ cells) PDX-M2 cells per mammary fat pad, photo of primary breast tumors, and tumor weight comparison between two groups to assess the lung metastases. N, Representative bioluminescence images of dissected lungs (left) and the relative lung metastases, presented as total flux of the lung bioluminescence, at 2 months of implantation. P values were calculated with Student t test using GraphPad, and data are represented as mean ± SD of 3–5 experimental replicates unless otherwise indicated.

