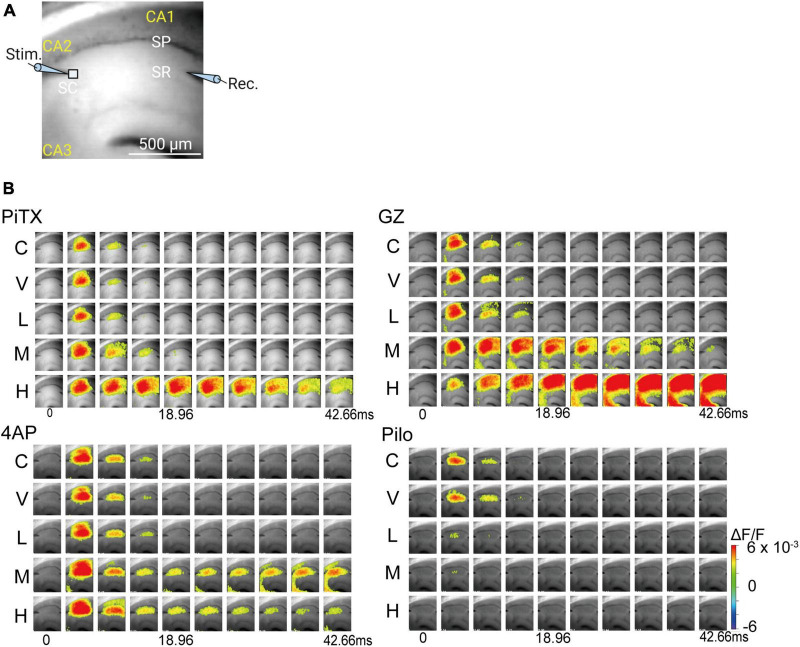
FIGURE 3.
Spread of neural activity upon single stimulation of hippocampus under seizurogenic compounds treatment. (A) Fluorescent image of mouse hippocampal slices captured with 90 × 80 pixels high speed camera system. (B) Typical spread pattern of evoked neural activity following electrical stimulation. The sequence of images are the neural activity map after stimulation with: PiTX (upper left), GZ (upper right), 4AP (lower left), and Pilo (lower right). Depolarization was measured as fractional changes in fluorescence in each pixel; this value is encoded in pseudocolor as indicated in the scale and superimposed on a fluorescent image of the slice. PiTX, picrotoxin; GZ, gabazine; 4AP, 4-amino pyridine; Pilo, pilocarpine; C, control; V, vehicle; L, low; M, middle; H, high; ΔF/F, ratio of the fractional change in voltage-sensitive dye fluorescence to the initial amount of fluorescence.

