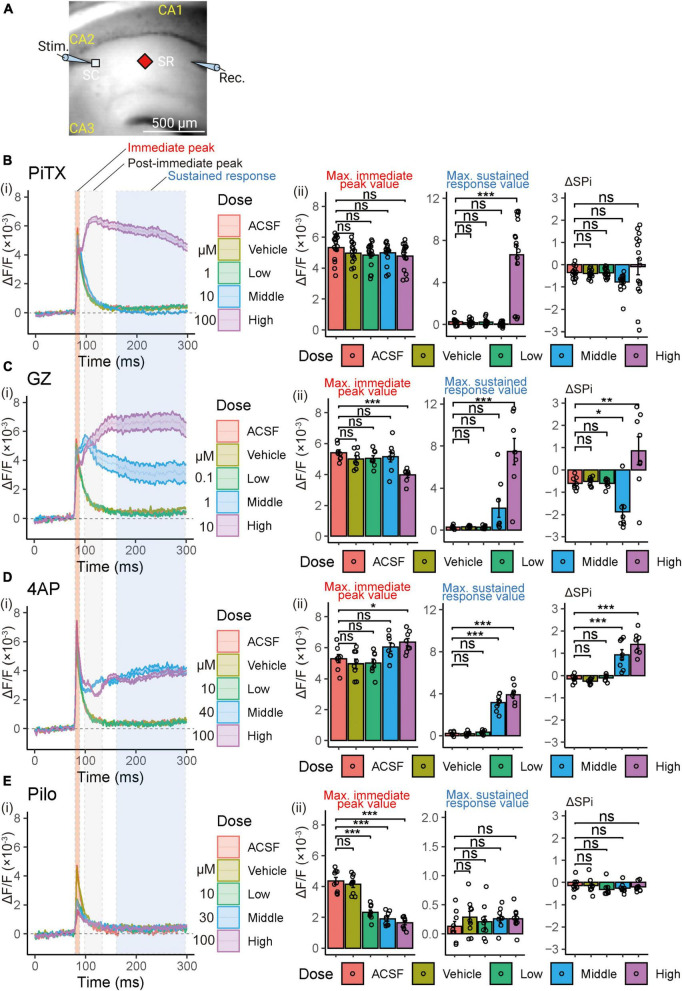
FIGURE 4.
Voltage-sensitive dye (VSD) optical response waveforms analysis following single stimulation in SR. (A) Illustration of the recording setup for optical signal detection (Captured 90 × 80 pixels high speed camera system). Maximum values of 3 parameter (immediate peak, post-immediate peak, and sustained response) were utilized for the analysis. Figure created using BioRender.com. (B–E) (i) Comparison of alterations in VSD optical response waveforms. Solid lines and corresponding shaded areas represent mean ± SEM, derived from n = 8 to 16 slices. (ii) Comparison of the maximum immediate peak values of the VSD optical response in the presence of increasing compound concentrations (left panel). Comparison of the maximum sustained response values of the VSD optical response in the presence of increasing compound concentrations (center panel). Comparison of the delta maximum values of the VSD optical response (sustained response value—post-immediate peak value; ΔSPi) in the presence of increasing compound concentrations (right panel). Effects are depicted as ΔF/F ± SEM from n = 8 to 16 slices. *p < 0.05; **p < 0.01; ***p < 0.001; ns, not significant (Dunnett’s test). ACSF, artificial cerebrospinal fluid; PiTX, picrotoxin; GZ, gabazine; 4AP, 4-amino pyridine; Pilo, pilocarpine; VSD, voltage-sensitive dye; SC, Schaffer collateral; SP, stratum pyramidale; SR, stratum radiatum.

