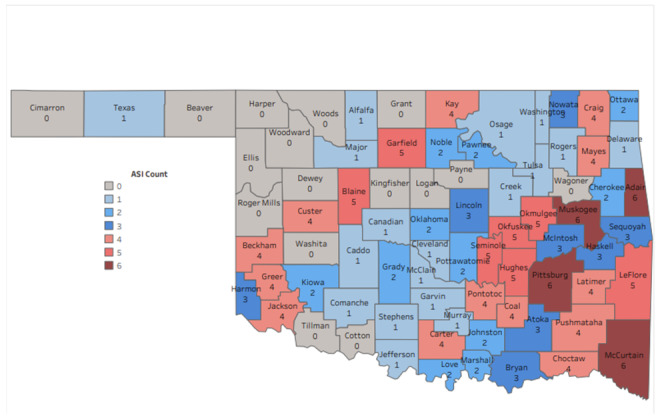
©Jason Walter Beaman, Cherie Josephine Miner, Cadence Bolinger. Originally published in JMIR Public Health and Surveillance (https://publichealth.jmir.org), 22.08.2023.
This is an open-access article distributed under the terms of the Creative Commons Attribution License (https://creativecommons.org/licenses/by/4.0/), which permits unrestricted use, distribution, and reproduction in any medium, provided the original work, first published in JMIR Public Health and Surveillance, is properly cited. The complete bibliographic information, a link to the original publication on https://publichealth.jmir.org, as well as this copyright and license information must be included.

