
Figure 3. Changes in Mean Systolic and Diastolic Blood Pressure From Randomization to 24 Hours After Randomization.
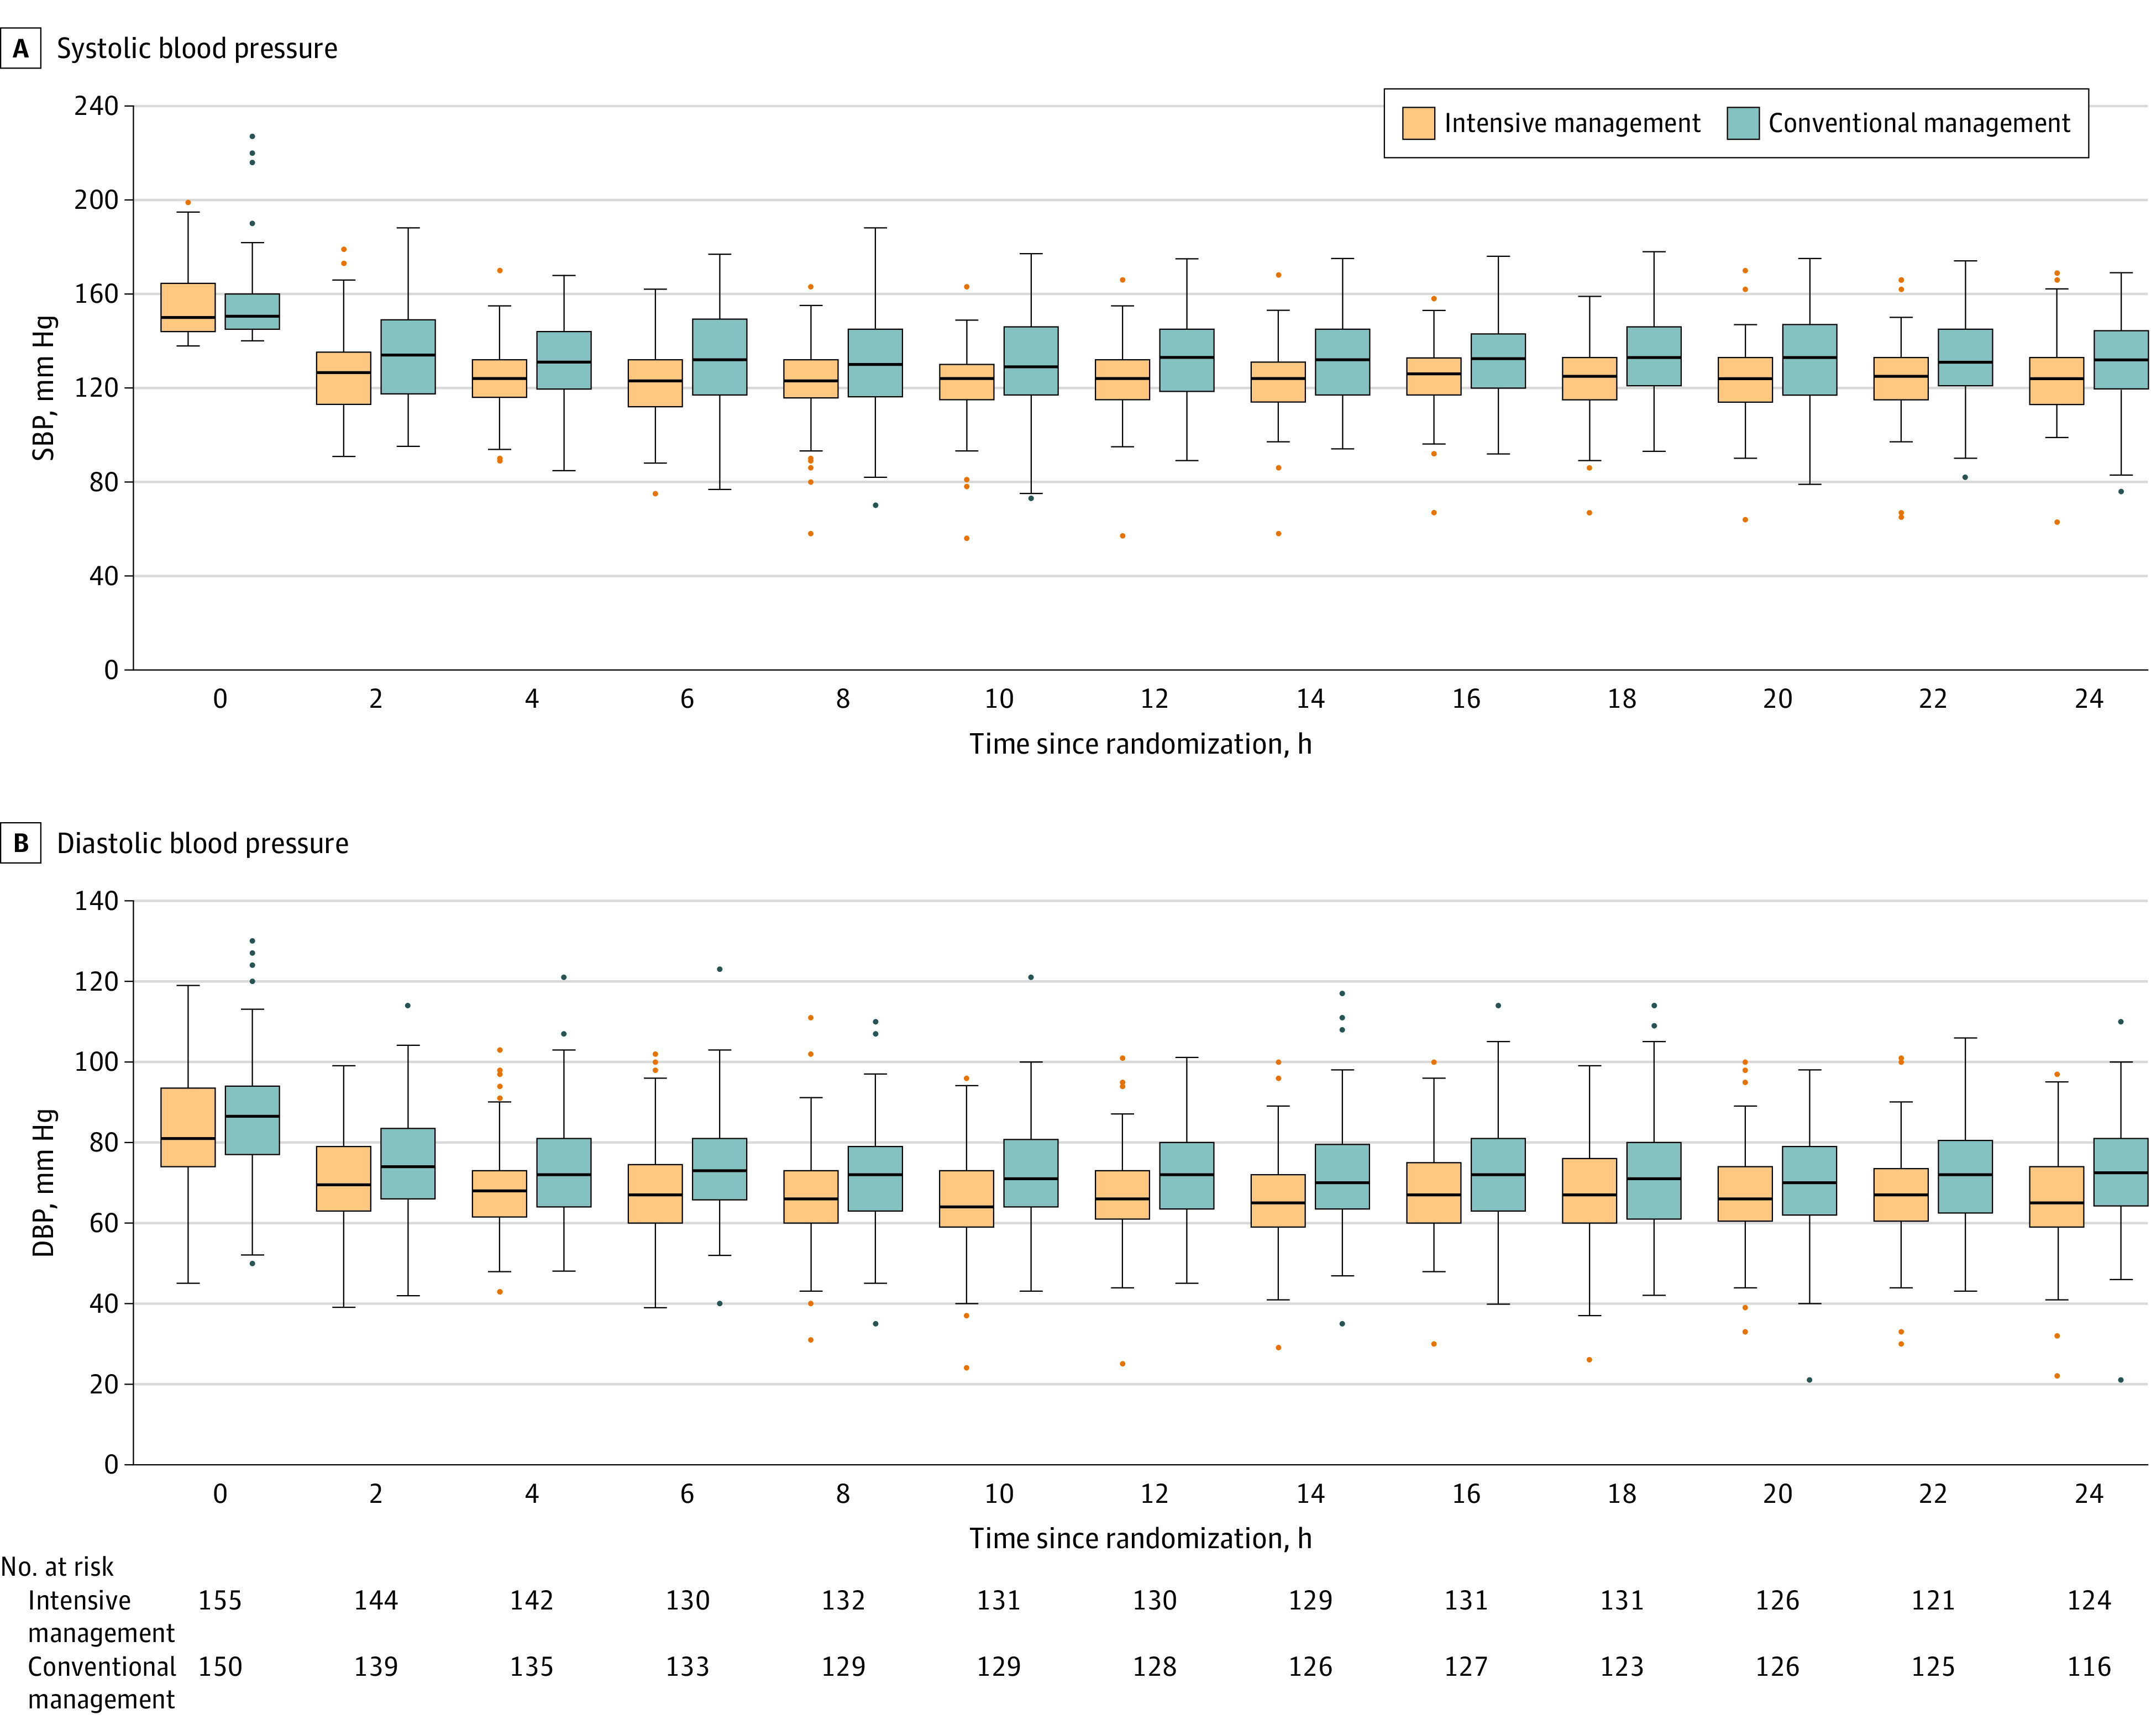
Compared with conventional management, intensive management significantly lowered mean systolic blood pressure (SBP; panel A) over 24 hours (129.2 mm Hg [SD, 7.7 mm Hg] vs 138.0 mm Hg [SD, 13.6 mm Hg]; P < .001) and mean diastolic blood pressure (DBP; panel B) over 24 hours (72.0 mm Hg [SD, 8.1 mm Hg] vs 77.0 mm Hg [SD, 9.9 mm Hg]; P < .001). The mean between-group difference in SBP over 24 hours was −9.6 mm Hg (95% CI, −12.2 to −6.9 mm Hg; P < .001), while the mean between-group difference in DBP over 24 hours was −5.5 mm Hg (95% CI, −7.6 to −3.3 mm Hg; P < .001). The black line within each box is the median blood pressure value at each respective time point; the upper and lower boundaries of the boxes represent the IQRs. Data points outside the boxes either surpass 1.5 times the value of the upper quartile or are less than 1.5 times the value of the lower quartile.