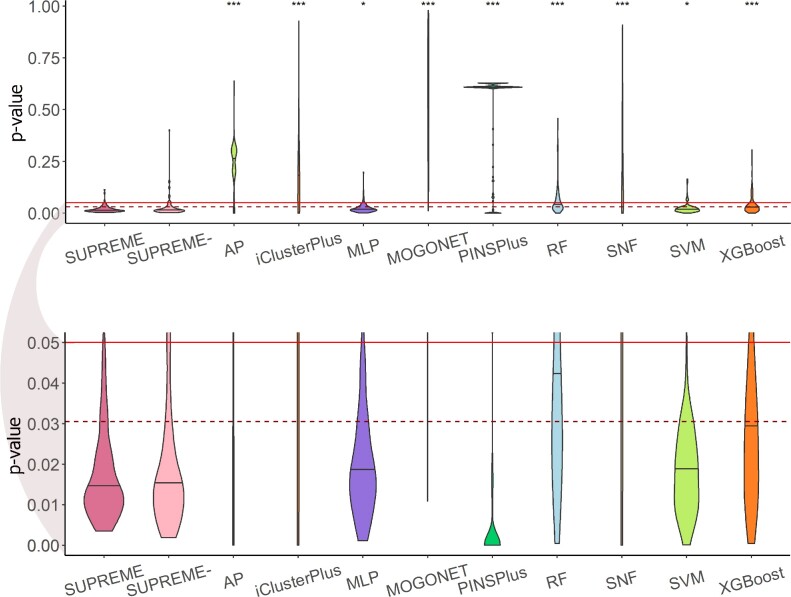
Figure 3.
Survival analysis results violin plot of the log-rank P-value obtained from survival analysis for the SUPREME models as compared to the cancer subtype prediction/clustering tools and baseline methods. Significance level was measured with respect to SUPREME (Wilcoxon rank-sum test P-value to compare the distribution of violin plots representing the significance <0.001 by ***, else if <0.01 by **, and else if <0.05 by *). The continuous line shows the significance level of 0.05 and the dashed line shows the ground truth’s significance level. The below figure focuses on the significant survival P-values (<0.05) [AP: affinity propagation, MLP: multi-layer perceptron, RF: random forest, SNF: similarity network fusion, SUPREME: SUPREME without raw feature integration, SVM: support vector machine].

