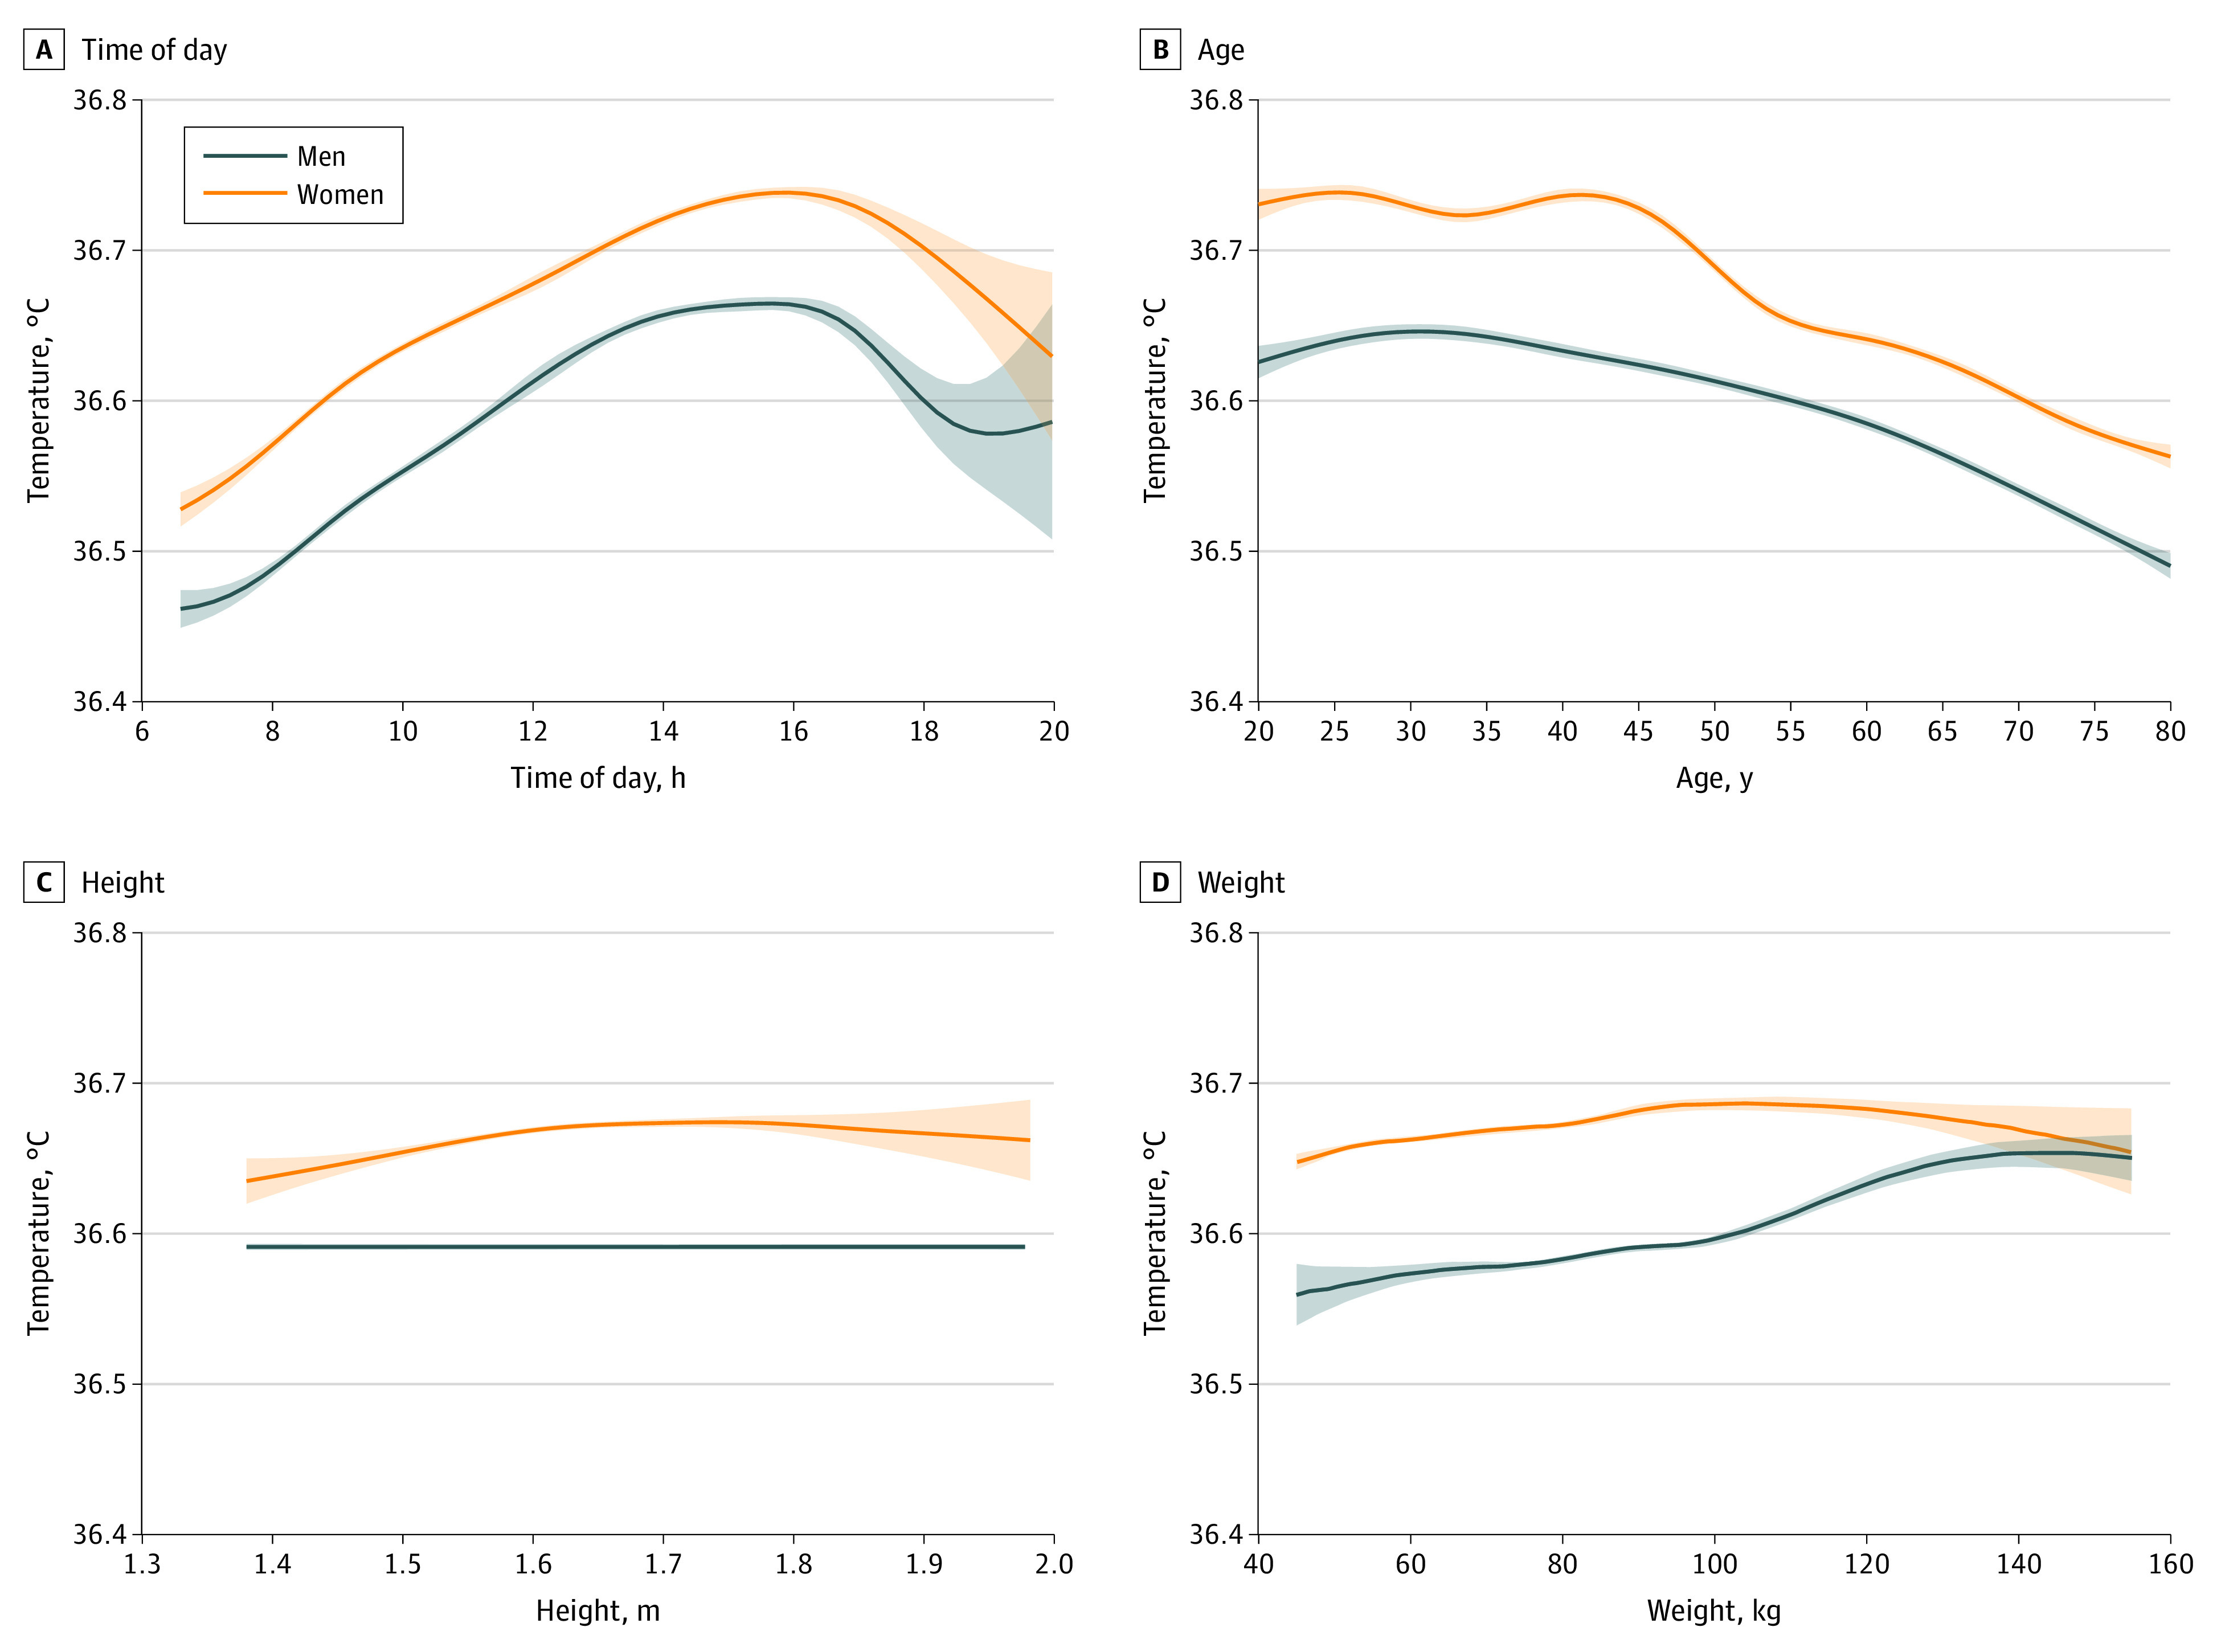
Figure 2. Temperature in Men and Women, by Time of Day and Demographic Characteristics.

Time of day is measured using a 24-hour clock. Shading marks the 95% CI. Each graph uses unadjusted (raw) data plotted with smoothing. To convert temperature to degrees Fahrenheit, multiply by 1.8 and add 32.
