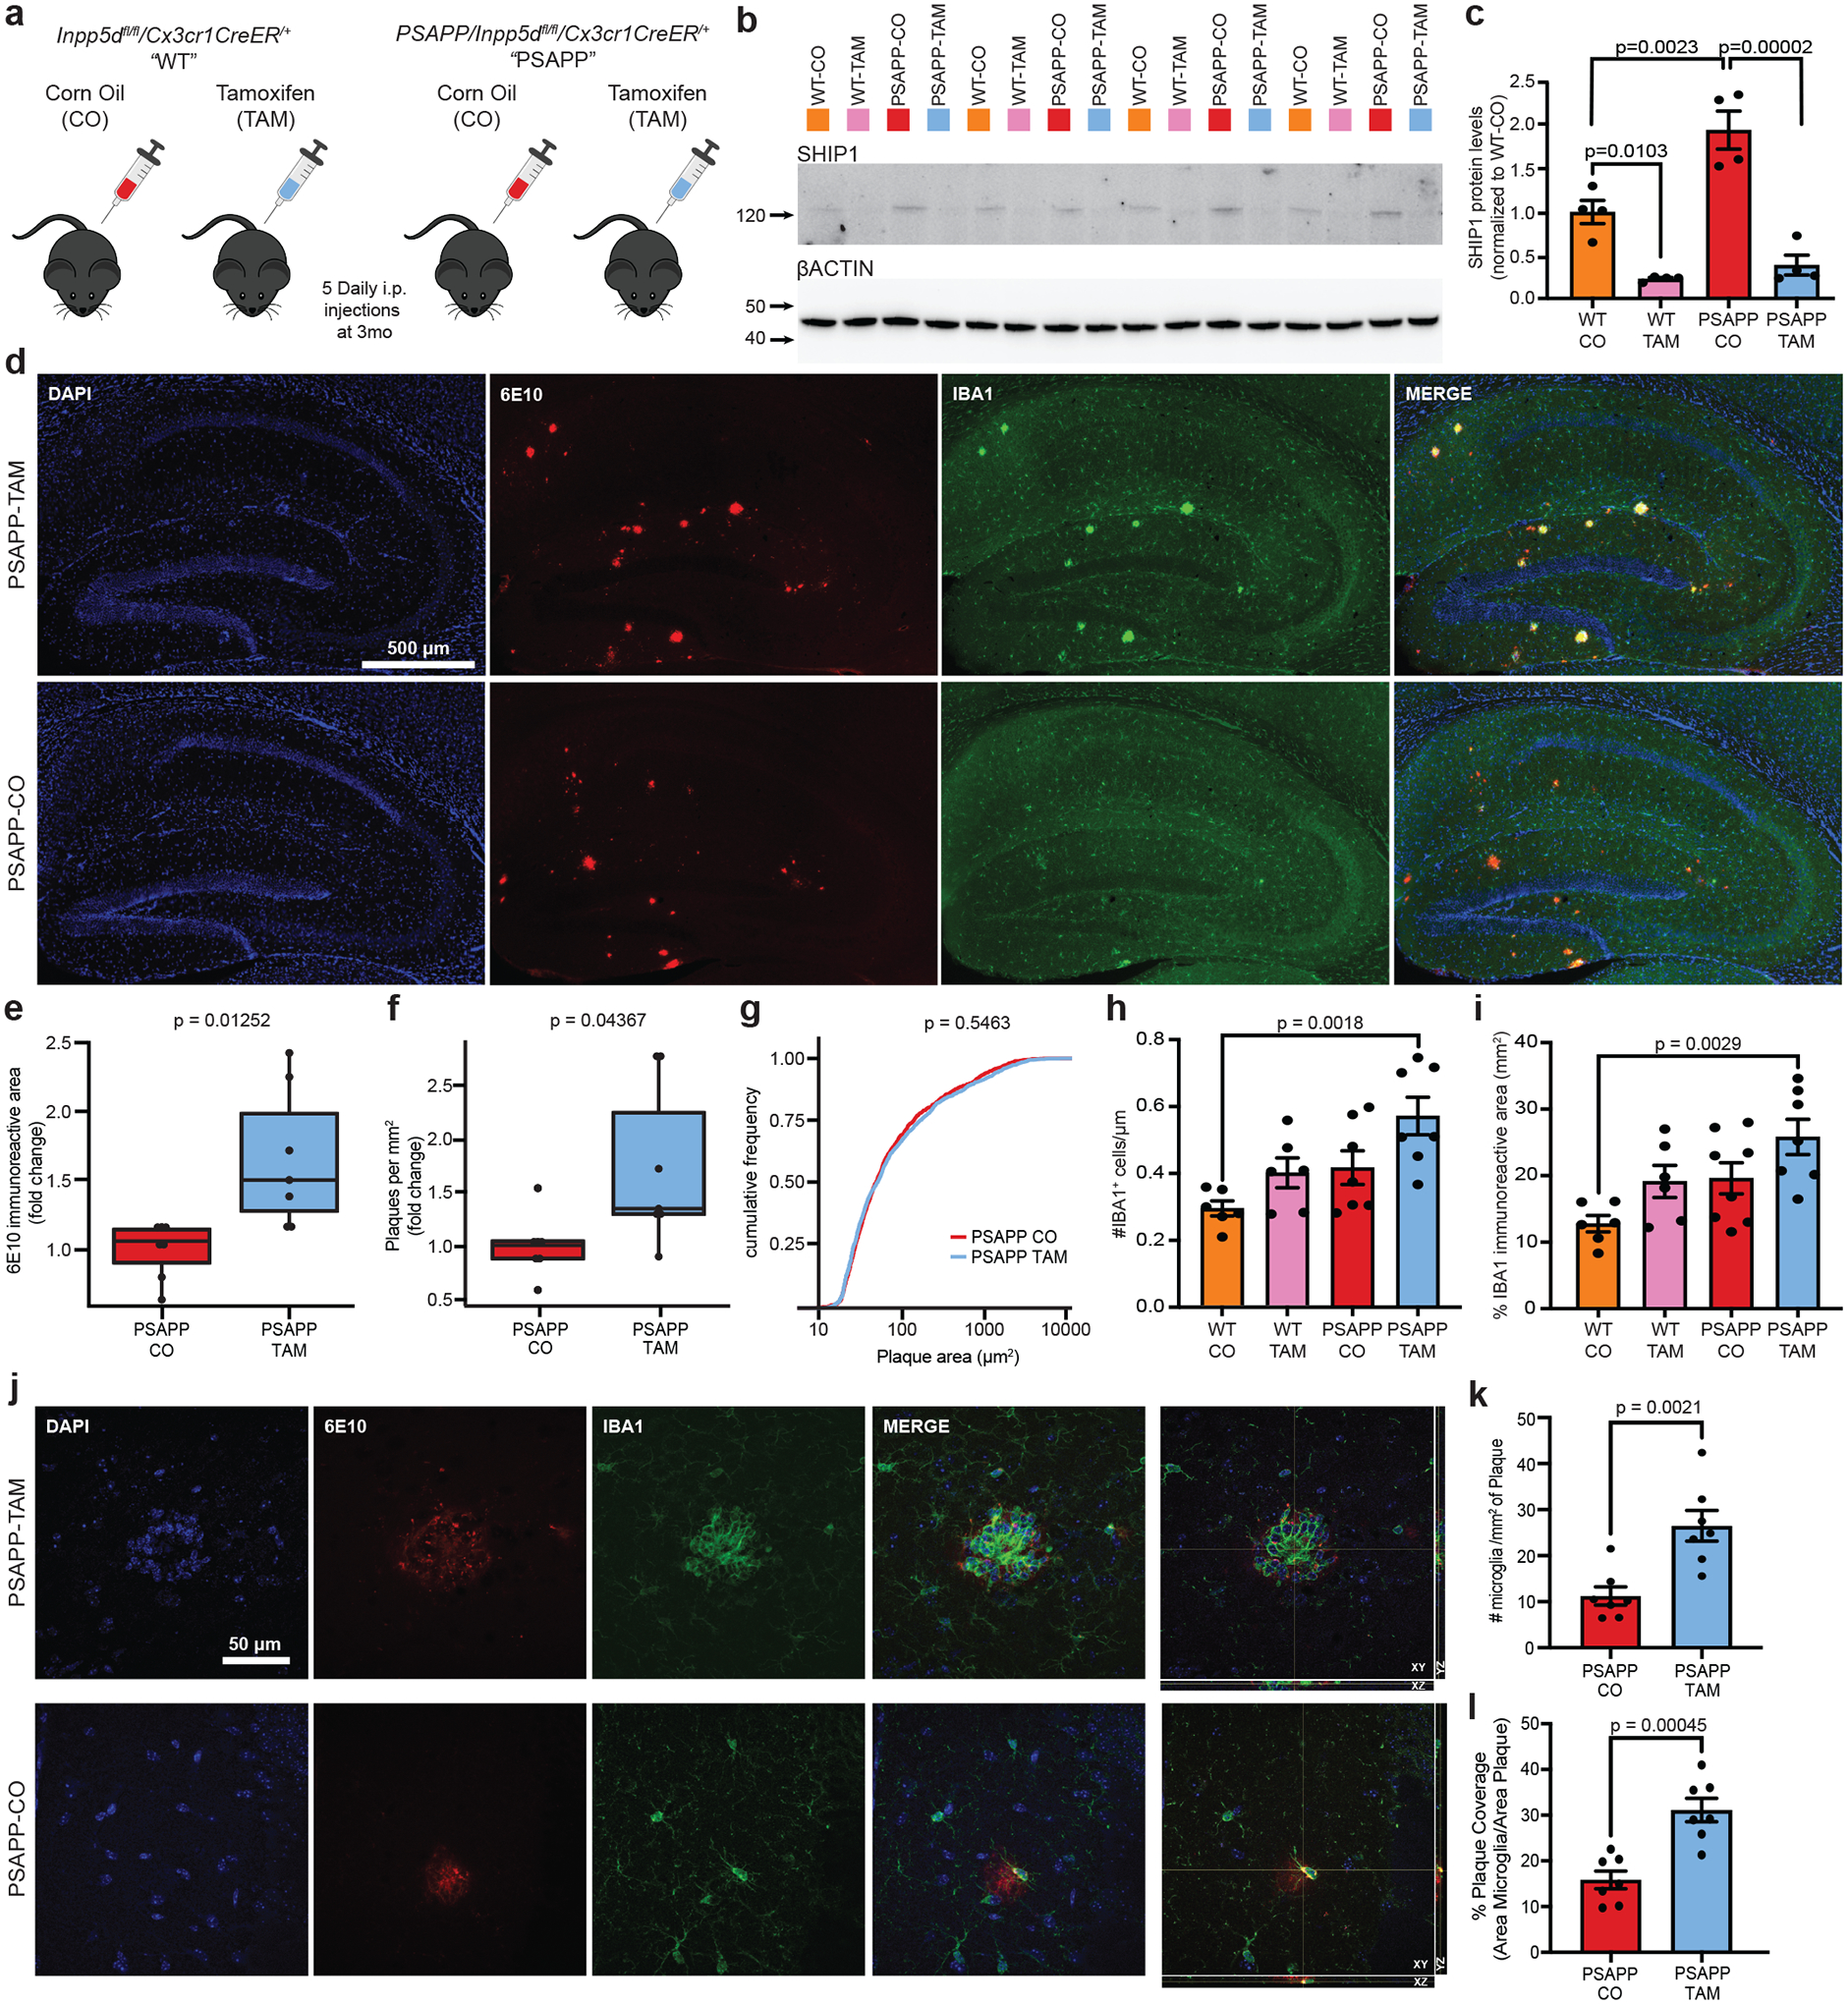
FIGURE 1. Inpp5d/ SHIP1 knockdown increased amyloid pathology and plaque-associated microglia number.

A, Inpp5dfl/fl/Cx3xr1CreER+ mice were crossed with the amyloid-depositing APPKM670/671NL/PSEN1Δexon9 mouse model of Alzheimer’s disease (AD) to obtain either heterozygous PSAPP mice, that is, PSAPP/Inpp5dfl/fl/Cx3xr1CreER+ (PSAPP) or wild-type littermates Inpp5dfl/fl/Cx3xr1CreER+ (WT). At age 3 months, male and female mice of both genotypes received daily injections of tamoxifen (TAM) or corn oil (CO) for 5 days before aging to the experimental timepoint of ages 6 to 6.5 months. B, Western blot of hippocampal tissue at 6 to 6.5 months of age using anti-SHIP1 (D1163) antibody normalized to β-actin. Quantification in (C). D, Representative images from 6-month PSAPP-TAM (top) and PSAPP-CO (bottom) mice stained with 6E10 (amyloid, red) or anti-IBA1 (myeloid cells, green). Scale bar = 500 μm. E, Relative fold change of 6E10-immunoreactive area in the hippocampi of male and female PSAPP-CO and PSAPP-TAM mice (n = 7 mice per group). F, Relative fold change of plaque numbers per mm2 in the hippocampi of male and female PSAPP-CO and PSAPP-TAM mice (n = 7 mice per group). For both (F) and (G), fold changes were calculated separately for each sex. G, Cumulative frequency of plaque areas of male and female PSAPP-CO and PSAPP-TAM mice (plaques from 8 mice per group). H, Quantification of number of IBA1+ microglia and (I) area of IBA1+ area in hippocampus from WT-CO, WT-TAM, PSAPP-CO and PSAPP-TAM (n = 6 to 7 mice per group). J, Confocal Z-stack and orthogonal views of plaques from PSAPP-TAM and PSAPP-CO mice. Quantification of plaque-associated microglia shown in (K). Scale bar = 50 μm. L, Quantification of plaque coverage by microglia (% area of IBA1 staining overlapping area of 6E10+ plaques) for PSAPP-CO and PSAPP-TAM (n = 7 mice per group). Bar graphs represent the mean and error bars represent standard error of the mean. P-values were calculated using unpaired t test (B, E, F, K, L), one-way analysis of variance with Tukey’s multiple comparison (C H, I), or by a Kolmogorov–Smirnov test (G)
