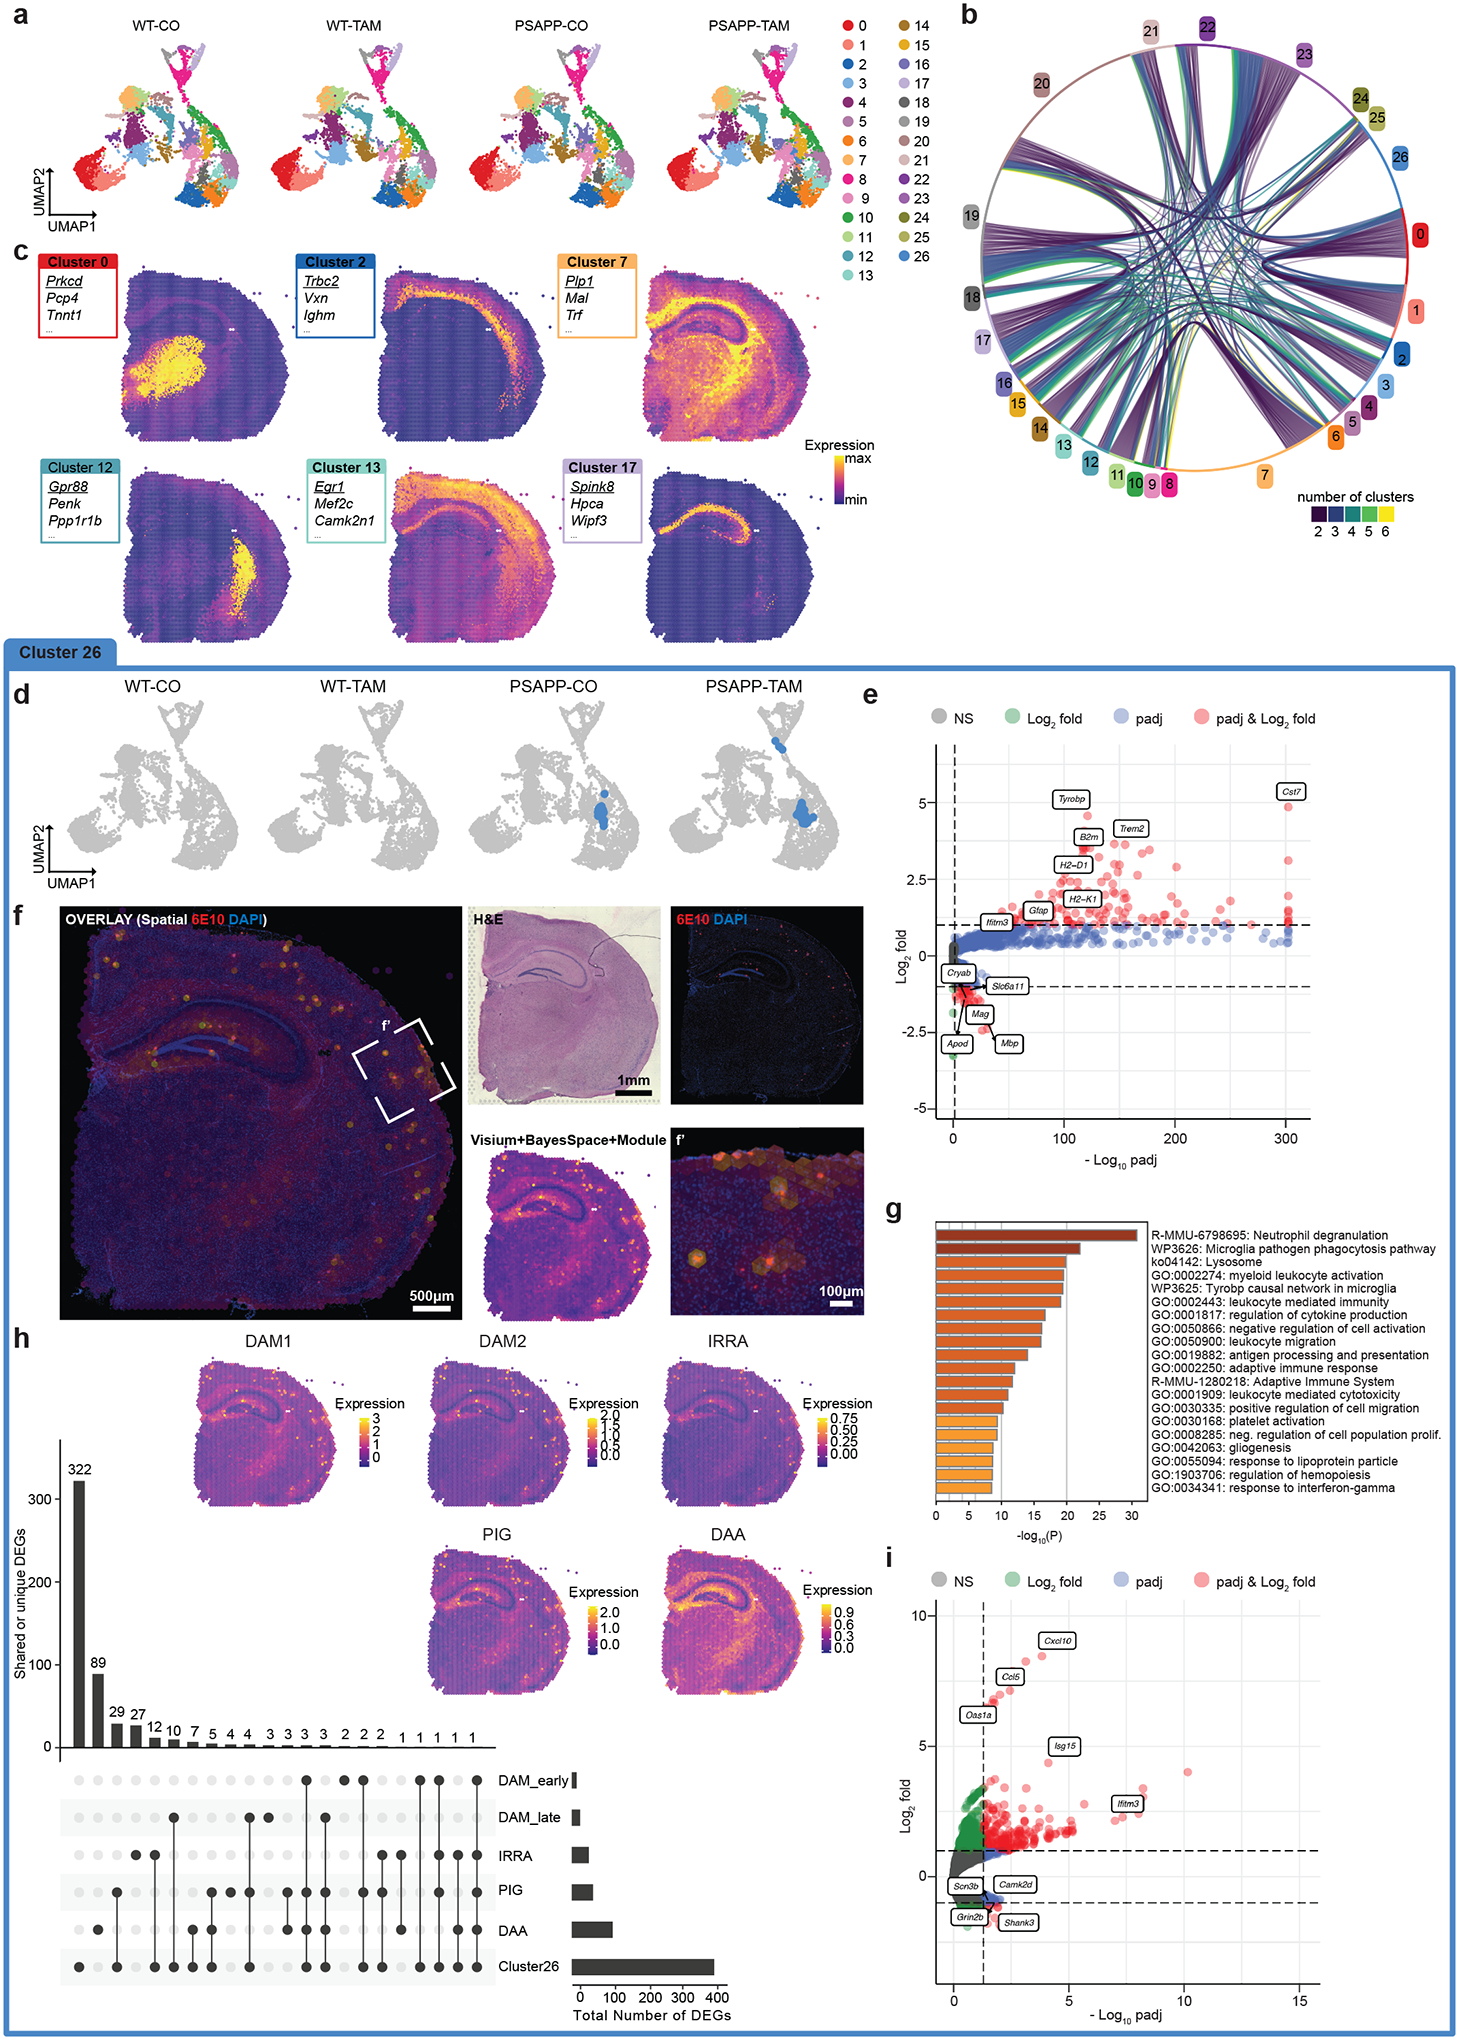
FIGURE 2. Spatial transcriptomics identified plaque-specific gene expression profiles exacerbated in Inpp5d/SHIP1 knockdown animals.

A, Uniform manifold approximation and projection (UMAP) dimensional reduction of wild-type (WT)-corn oil (CO) (8037 spots, 3 sections), WT-tamoxifen (TAM; 8882 spots, 3 sections), PSAPP/Inpp5dfl/fl/Cx3xr1CreER+ (PSAPP)-CO (7748 spots, 3 sections), and PSAPP-TAM (9366 spots, 3 sections). Each dot represents a Visium transcriptomics spot. The 27 color-coded clusters correspond to brain areas/regions (see below). B, Chord diagram of genes enriched > 1 log2 fold (l2f) in each cluster and adjusted P-value < 0.05. Each string represents a gene shared between two and six other clusters. C, Example clusters highlighted in a Visium brain section. Boxes show top three enriched genes per cluster. Underlined gene is highlighted in the SpatialFeaturePlot. D, UMAP with Cluster 26 highlighted showing that it is only present in PSAPP animals. E, Volcano plot of genes enriched in Cluster 26 as calculated with Seurat’s FindAllMarkers function. Red genes are l2f > 1 and padj < 0.05, blue l2f < 1 and padj < 0.05, green genes are l2f > 1 and padj > 0.05, gray genes are l2f < 1 and padj > 0.05. F, Module score of Cluster 26 and 6E10 (amyloid) staining of the adjacent brain section shows colocalization. f’ shows higher magnification of box in (F). G, Gene Ontology term analysis of genes enriched l2f > 1 in Cluster 26 using metascape.73 H, UpSet plot highlighting the overlapping and unique genes between previously defined reactive microglia and astrocyte subtypes: Disease-associated microglia, DAM1 (early) and DAM2 (late),25 interferon-responsive reactive astrocytes (IRRAs),28 plaque-induced genes (PIGs),27 as well as disease associated astrocytes (DAA).26 Insets are module scores of the genes in each reactive subtype highlighted on a PSAPP-TAM spatial transcriptomics brain section. For IRRAs, DAAs and Cluster 26, genes were filtered for padj < 0.05 and l2f > 0.5. For DAM1, DAM2, and PIGs, genes were selected based on gene sets provided in the original publication. I, Genes differentially expressed in Cluster 26 between APP-CO and APP-TAM as calculated with edgeR on sum of counts using muscat (red genes are l2f > 1 and padj < 0.05, blue l2f < 1 and padj < 0.05, green genes are l2f > 1 and padj > 0.05, gray genes are l2f < 1 and padj > 0.05).
