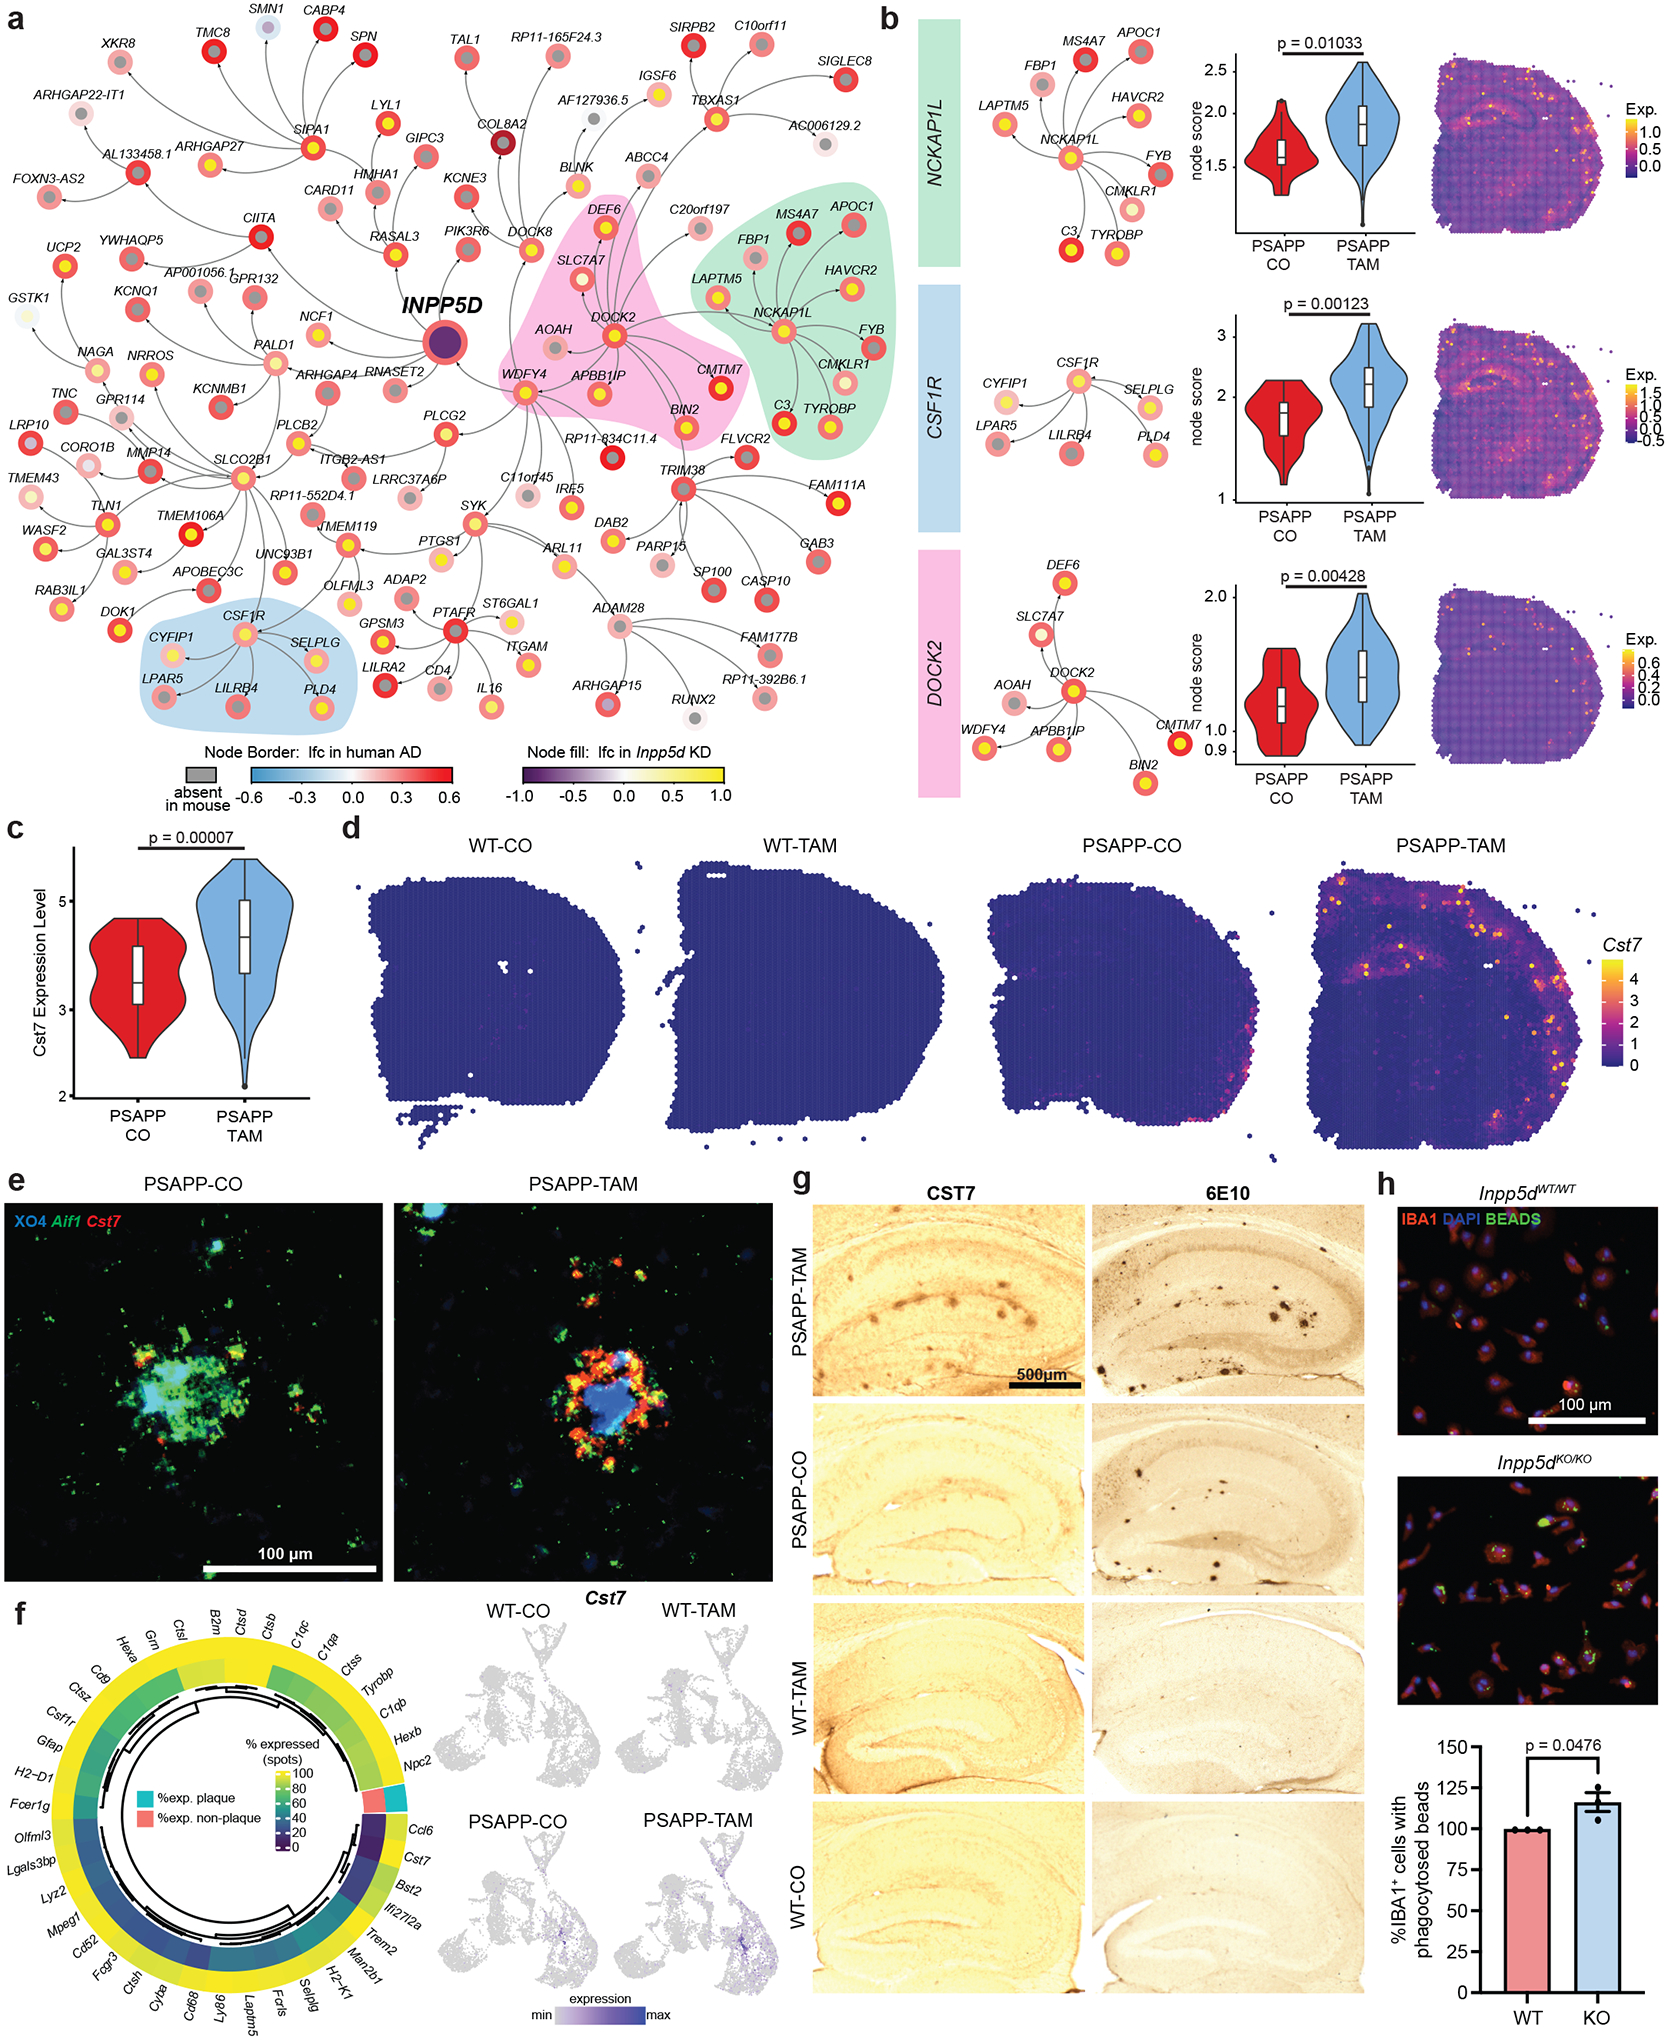
FIGURE 3. Top Cluster 26 differentially expressed gene Cst7 was a plaque-specific marker and was exacerbated by Inpp5d knockdown.

A, Network showing the gene expression change in human Alzheimer’s disease (AD) and Inpp5d knockdown mice within the neighborhood of four steps of INPP5D. Node border paint denotes the log2 fold-change (lfc) in human AD brains compared to control brains. Node fill paint denotes the log2 fold-change caused by Inpp5d in mice, with gray color denoting absence in mouse data. B, Highlight of specific nodes from network in (A). Genes associated with each node were enriched in cluster 26 from PSAPP/Inpp5dfl/fl/Cx3xr1CreER+ (PSAPP)-tamoxifen (TAM) compared to PSAPP-corn oil (CO) mice (violin plots, middle, P-values from unpaired t test) and can be spatially resolved by probing for this module in spatial transcriptomic brain sections (right). C, Violin plots of Cst7 in Cluster 26 across PSAPP-CO and PSAPP-TAM shows increased expression in PSAPP-TAM plaque spots as calculated with edgeR on sum of counts using muscat. D, Cluster 26 marker gene Cst7 highlighted in wild-type (WT)-CO, WT-TAM, PSAPP-CO, and PSAPP-TAM brain sections. E, RNAScope of Cst7 (red) and Aif1 (green) with Methoxy-XO4 (blue) staining in PSAPP-CO and PSAPP-TAM mouse cortex. Scale bar = 100 μm. F, Left: Percentage expression of the top Cluster 26 enriched genes in Cluster 26 (outer ring) versus the average percentage expression in all other clusters (inner ring). Right: FeaturePlots showing expression of Cst7 in all spots across WT-CO, WT-TAM, PSAPP-CO, and PSAPP-TAM brain sections. G, CST7 antibody staining detected with DAB and 6E10 in adjacent section from WT-CO, WT-TAM, PSAPP-CO, and PSAPP-TAM hippocampus. Scale bar = 500 μm. H, Representative images of latex bead phagocytosis assay on Inpp5d-WT mouse primary microglia and Inpp5d-knockout (KO) primary microglia with quantification of percentage IBA1+ cells with phagocytosed fluorescent bead (right). Scale bar = 100 μm. Quantification was performed from three to four wells per group; with N = 3 independent experiments. Data points represent mean normalized to Inpp5d-WT per experiment. P-values calculated with unpaired t test.
