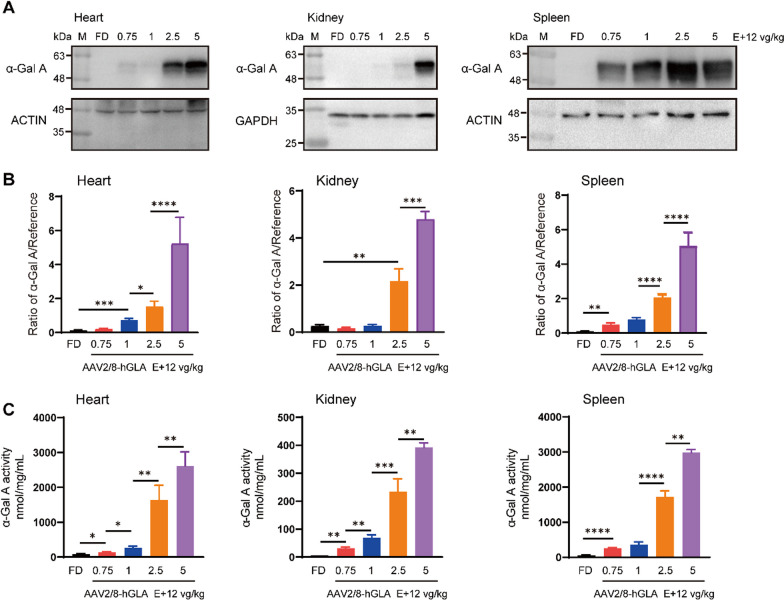
Fig. 4.
Uptake of α-Gal A in various tissues of AAV2/8-hGLA–treated FD mice. FD mice were intravenously administered formulation buffer or the AAV2/8-hGLA at doses of 0.75E + 12, 1E + 12, 2.5E + 12, and 5E + 12 vg/kg, and tissues were collected at 12 weeks post-injection; representative Western blot analyses are shown. A α-Gal A protein content in tissues of FD mice treated with different doses AAV2/8-hGLA determined 12 weeks after administration, and B relative gray value analyses were performed. C α-Gal A activity was determined in different tissues of the treated FD mice. α-Gal A enzyme activity was measured using the α-Galactosidase (α-GAL) Activity Assay Kit. Data are presented as the mean ± SEM (n = 4–6). *P < 0.05, **P < 0.01, ***P < 0.001, ****P < 0.0001. Unpaired t-tests were used to compare two groups of data

