
Figure EV2. ChrRNA read‐through phenotype is more pronounced in CTD‐∆5 compare with YFFF mutant.
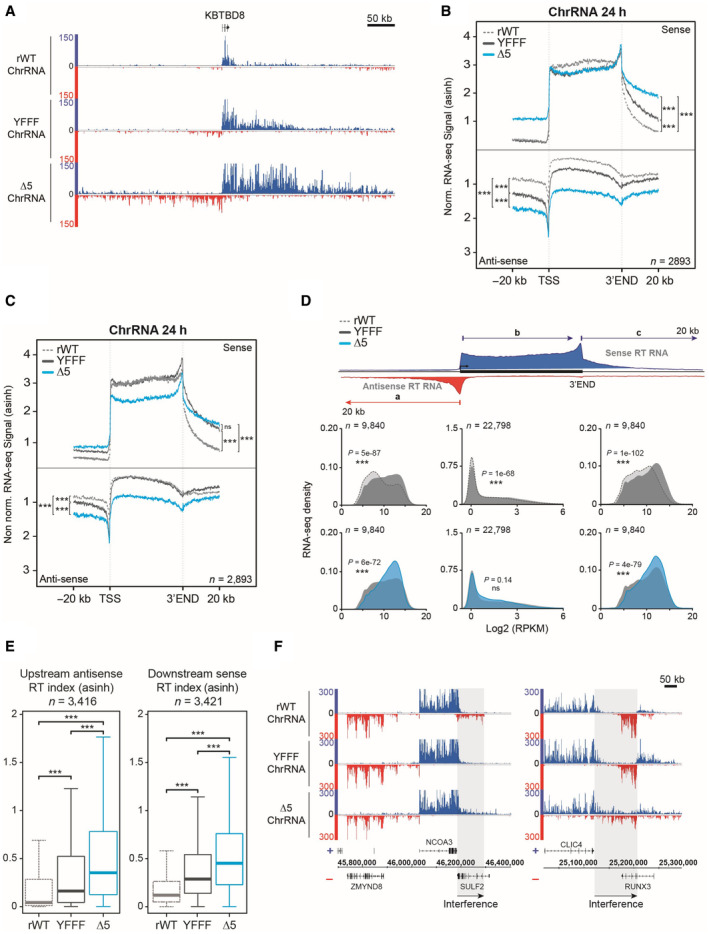
- Example of read‐through phenotype in ChrRNA‐seq datasets YFFF and CTD‐∆5 at the 5′ (antisense) and 3′ (sense) ends of the KBTBD8 gene compared with rWT.
- Average metagene profiles of ChrRNA‐seq signals in sense and antisense directions (top and bottom, respectively) over the gene bodies of expressed protein‐coding genes and the 20 kb upstream and downstream surrounding regions in rWT (dotted gray line), YFFF (dark gray line) and CTD‐∆5 (blue). All profiles are asinh transformed and normalized over the gene bodies of the rWT for the mutants. Experiments were done in biological duplicates. P‐values were calculated using two‐sided Wilcoxon tests. P‐values associated with read‐through in sense direction: rWT vs. YFFF = 2e‐70, rWT vs. CTD‐∆5 = 8e‐146, and CTD‐∆5 vs. YFFF = 1e‐87. For read‐though in antisense direction: rWT vs. YFFF = 9e‐121, rWT vs. CTD‐∆5 = 5e‐165, and CTD‐∆5 vs. YFFF = 2e‐146.
- Average metagene profiles of ChrRNA‐seq signals in sense and antisense directions (top and bottom, respectively) over the gene bodies of expressed protein‐coding genes and the 20 kb upstream and downstream surrounding regions in rWT (dotted gray line), YFFF (dark gray line) and CTD‐∆5 (blue). Profiles are asinh transformed and non‐normalized on gene bodies. Experiments were done in biological duplicates. P‐values were calculated using two‐sided Wilcoxon tests. P‐values associated with read‐through in sense direction: rWT vs. YFFF = 5e‐109, rWT vs. CTD‐∆5 = 2e‐112, and CTD‐∆5 vs. YFFF = 0.41. For read‐though in antisense direction: rWT vs. YFFF = 8e‐152, rWT vs. CTD‐∆5 = 4e‐154, and CTD‐∆5 vs. YFFF = 4e‐17.
- Density plots of ChrRNA‐seq signals in rWT, YFFF, and CTD‐∆5 mutant on protein‐coding genes (a) The antisense 20 kb regions upstream of genes (b) The sense gene body and (c) The sense 20 kb regions downstream of genes in rWT (light gray), YFFF (dark gray), and CTD‐∆5 (blue). Experiments were done in biological duplicates. P‐values were calculated using two‐sided Wilcoxon tests. RPKM, Reads per kilobase per million mapped reads.
- Boxplots of ChrRNA read‐through (RT) indexes based on signal over 20 kb upstream (antisense) and downstream (sense) regions of coding genes in rWT (dotted gray line), YFFF (dark gray), and CTD‐∆5 mutant (blue). Units are asinh transformed. P‐values were calculated using two‐sided Wilcoxon tests. Experiments were done in biological duplicates. Boxplots represent minimal and maximal values, first and third quartiles with median value as central band. P‐value associated with antisense RT index in rWT vs. YFFF = 2e‐90, rWT vs. CTD‐∆5 = 4e‐254, and CTD‐∆5 vs. YFFF = 8e‐71. Concerning downstream RT indexes: rWT vs. YFFF = 5e‐181, rWT vs. CTD‐∆5 < 2e‐254, and CTD‐∆5 vs. YFFF = 2e‐66.
- Examples of ChrRNA‐seq signals showing potential transcription interference of SULF2 and RUNX3 in YFFF and CTD‐∆5 mutants due to RT in sense direction from NCOA3 and CLIC4, respectively.
Source data are available online for this figure.