
Figure EV3. Pol II accumulation is reduced at promoters in CTD‐∆5 context and lost at 3′ end of coding genes.
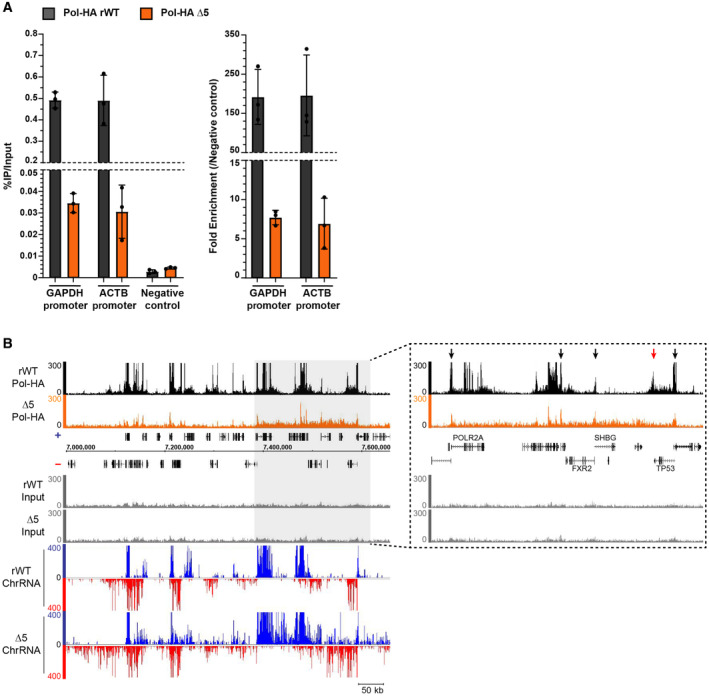
- qPCR showing the enrichment of Pol‐HA ChIP on positive regions compared with negative control in rWT (black) and CTD‐∆5 (orange). Left: Percentage of IP over Input for each target. Right: Fold enrichment normalized on negative control. Error bars represent the mean with SD of 3 technical replicates.
- Example of Pol‐HA ChIP‐seq signal in rWT (black) and CTD‐∆5 (orange) as well as their associated Input profiles and ChrRNA signals. Light gray rectangle highlights a region in which there is a global accumulation of Pol‐HA in CTD‐∆5 associated with read‐through at ChrRNA level. Right: Extended view of the region highlighted in light gray. Black arrows show promoter‐associated Pol‐HA accumulation in both rWT and CTD‐∆5. Red arrow shows 3′‐end Pol‐HA accumulation in rWT, which is lost in CTD‐∆5 mutant. Experiments were done in biological duplicate, however, only the sample with the best signal‐to‐noise ratio was used for subsequent analysis.