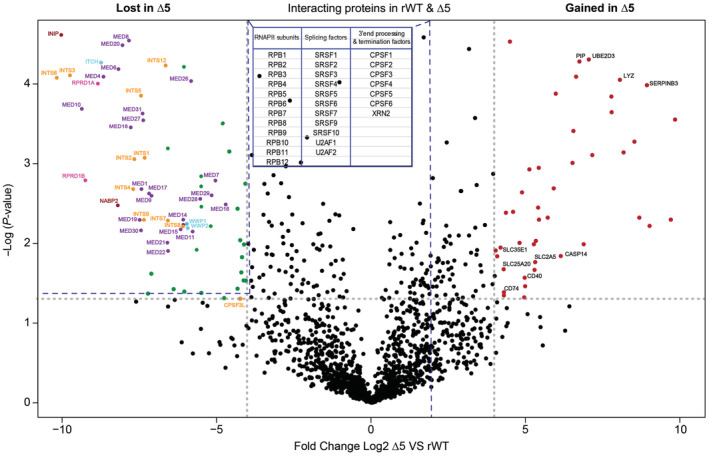
Figure 5. Mass spectrometry differential analysis of rWT and CTD‐∆5 interactomes.

Volcano plot comparing the Pol II interactome in rWT and CTD‐∆5 mutant. Left: Proteins lost in CTD‐∆5, Right: Proteins enriched in CTD‐∆5. Highlighted are the subunits of the Mediator (purple) and Integrator complexes (orange) CTD phosphatases scaffolds (pink), ubiquitin ligases (light blue), and SOSS complex subunits (red). In black are highlighted some chosen interactors gained by the CTD‐∆5 Threshold: log2 fold change ≥ 4; P‐value < 0.05. Data based on three independent biological replicates. See also Datasets EV1 and EV2 for a detailed list of lost and gained proteins in the CTD‐∆5 mutant context, respectively. The table in the figure sums up the proteins that do not change significantly; dotted lines connected to the table represent the region where these proteins are found in the volcano plot. See Dataset EV3 for the details (P‐values, fold change, and peptide count).
