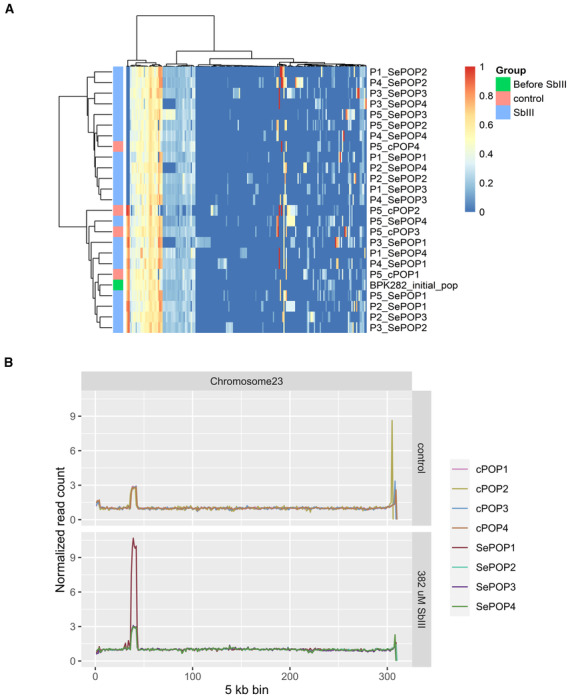
Figure EV2. Additional genomic changes associated with the SbIII‐Flash selection performed on the barcoded BPK282 population.

- Heatmap depicting the allele frequencies of SNPs and indels identified in protein coding regions compared to the reference genome. An additional annotation bar display to which group (control or SbIII‐exposed) a sample belongs. Samples are named as Px_cPOPy for controls, and Px_SePOPy for the SbIII‐exposed groups, with x being the number of passages and y being the replicate number. The initial population is named as ‘Before SbIII’.
- Copy number variation in the MRPA locus. The Y axis represents the median read count of 5 kb bins normalized by the median count of chromosome 23 and reflects the average copy number per haploid genome of the MRPA locus.
