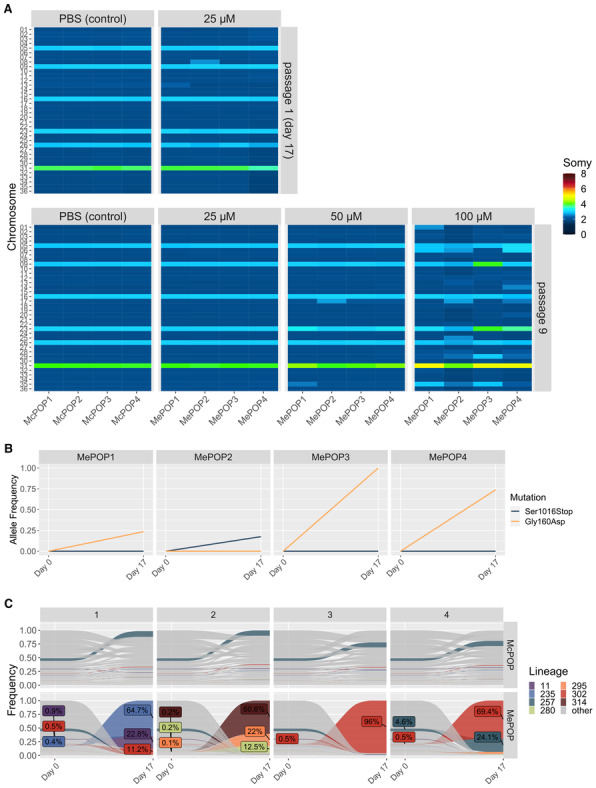
Figure 3. Flash selection with miltefosine.

- Bulk aneuploidy profile of the populations kept under different concentrations of miltefosine (four replicates per concentration—MePOP1‐4) at passages 1 (upper panel) and passage 9 (bottom panel).
- Allele frequency of the Gly160Asp and the Ser1016Stop mutations identified in the miltefosine‐transporter gene (LdMT) in the drug‐exposed populations.
- Tracing of lineages before (day 0) and after 17 days (passage 1) under selection with 25 μM miltefosine (MePOP) or with PBS as control (McPOP). Only lineages that reached frequencies higher than 1% in at least one population in the last timepoint (day 17) are colored. Colored labels display the frequency of some lineages at day 0 and day 17.
Source data are available online for this figure.
